
Census.gov > Library > Infographics & Visualizations > 2021 > Population Bracketology
Library
Population Bracketology
March 16, 2021
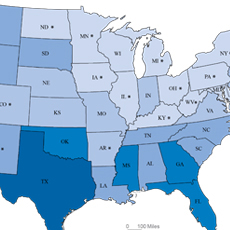
Test your knowledge of population data! Start by choosing your geographic level: metro areas or states. Click on the name in each match-up that you think has the larger population. Green shows a correct answer, red indicates an incorrect answer. When you have opposing names picked for the next round, pick again. See how close you can come to a perfect score of 63. When you are finished, play again or mouse-over results to view the most current population estimates for each pair.
Current Score: |
| Metro Area Population | |
| State Population |
| Your score was: | ||
| XX | out of | 63 |
SOURCE: Vintage 2019 Population Estimates and the International Data Base
NOTES: Winners in each metro area match-up are based on a comparison of the July 1, 2019 population estimates. Metro areas included are the 64 most populous (based on 2019 population) in the 50 states and District of Columbia. Metro areas are based on the September 2018 Office of Management and Budget delineation; see www.census.gov/programs-surveys/metro-micro.html for more information. Abbreviated metro area titles are shown in the display; complete titles are shown in the data table and in the mouse-over available at the end of each game. Data for the 50 states, D.C., and Puerto Rico are based on July 1, 2019 population estimates. For more information about the population estimates see www.census.gov/programs-surveys/popest.html. Mid-year 2019 population estimates for Guam, the Commonwealth of the Northern Mariana Islands, the U.S. Virgin Islands, and American Samoa are from the International Data Base available at https://www.census.gov/data-tools/demo/idb/informationGateway.php.
Recent Data Visualizations
 Population Without Health Insurance
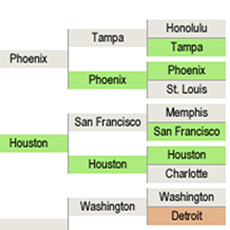 Population Bracketology
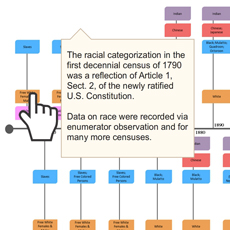 Measuring Race and Ethnicity Across the Decades: 1790-2010
 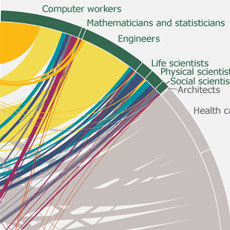 Where do college graduates work?
 Story Maps Illustrate Population Change
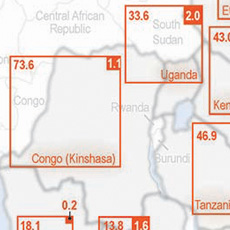 HIV/AIDS Impact in Africa
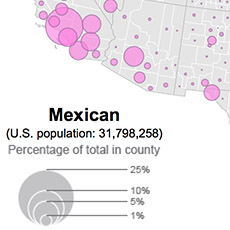 Distribution of Hispanic or Latino Population by Specific Origin: 2010
 A Century of Population Change in the Age and Sex Composition of the Nation
 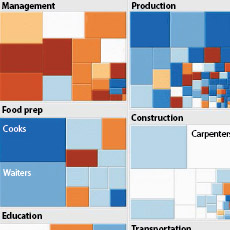 Shifting Occupational Shares
 Metro Area Density
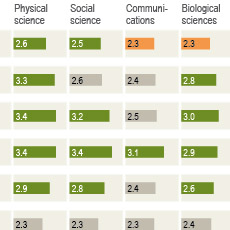 Work-Life Earnings
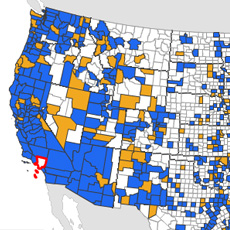 Census Flows Mapper
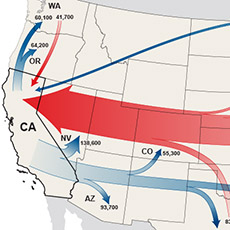 Migration Between Calif. & Other States
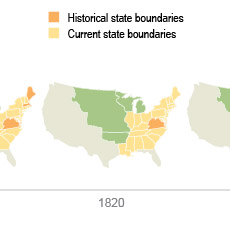 U.S. Territory and Statehood Status
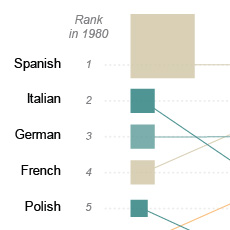 Spoken Languages Other than English
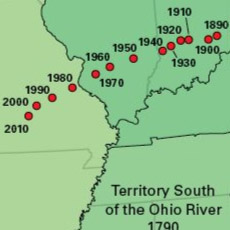 Center of Population, 1790-2010
 Population Change by Decade
 Without A High School Education
 A Decade of State Population Change
 State-to-State Migration for States of 8 Million or More
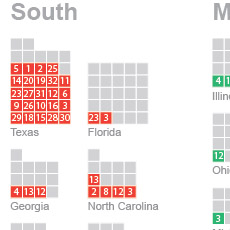 Population Under 5 Years Old by Congressional District
 Components of Metro Area Change
 Blooming States
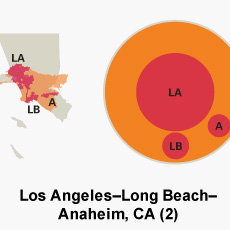 Coastline County Population
 Coastline County Population
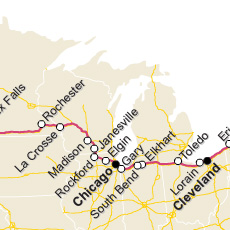 I-90 Population Density Profile, 2010
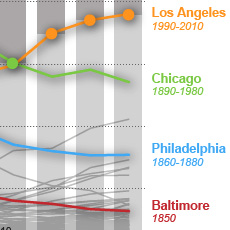 Second Cities: Keeping Pace with a Booming New York
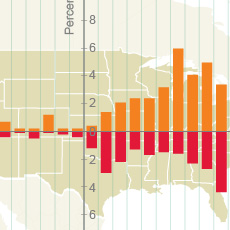 By the Grid: Population Shift to the West and South
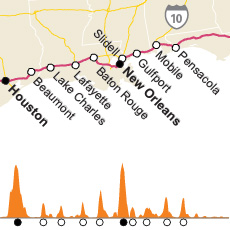 I-10 Population Density Profile, 2010
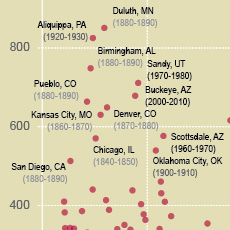 Booming Cities Decade-to-Decade, 1830-2010
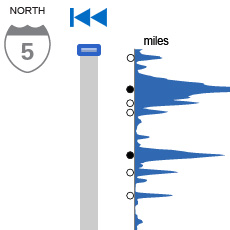 I-5 Population Density Profile, 2010
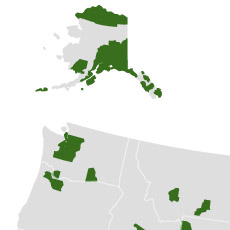 Islands of High Income
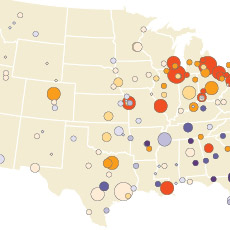 The Great Migration, 1910 to 1970
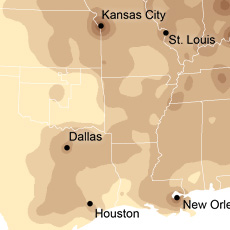 Following the Frontier Line, 1790 to 1890
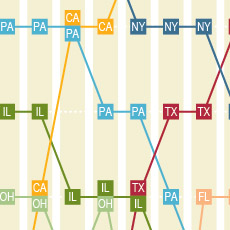 Changing Ranks of States by Congressional Representation
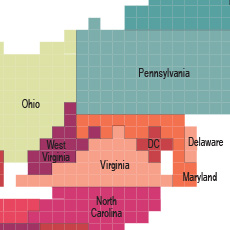 Cartograms of State Populations in 1890, 1950, and 2010
 Before and After 1940: Change in Population Density
 From Physical to Political Geography
 Differential City Growth Patterns
 I-95 Population Density Profile
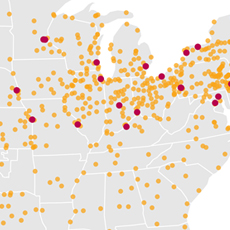 Increasing Urbanization
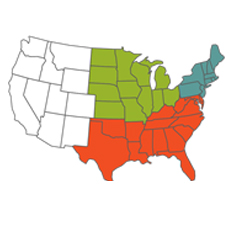 Gaining and Losing Shares
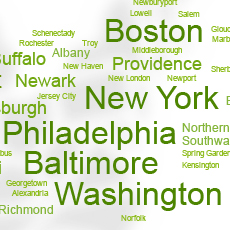 Top 20 Cities

