
Census.gov > Library > Infographics & Visualizations > 2013 > Distribution of Hispanic or Latino Population by Specific Origin: 2010
Library
Distribution of Hispanic or Latino Population by Specific Origin: 2010
September 30, 2013
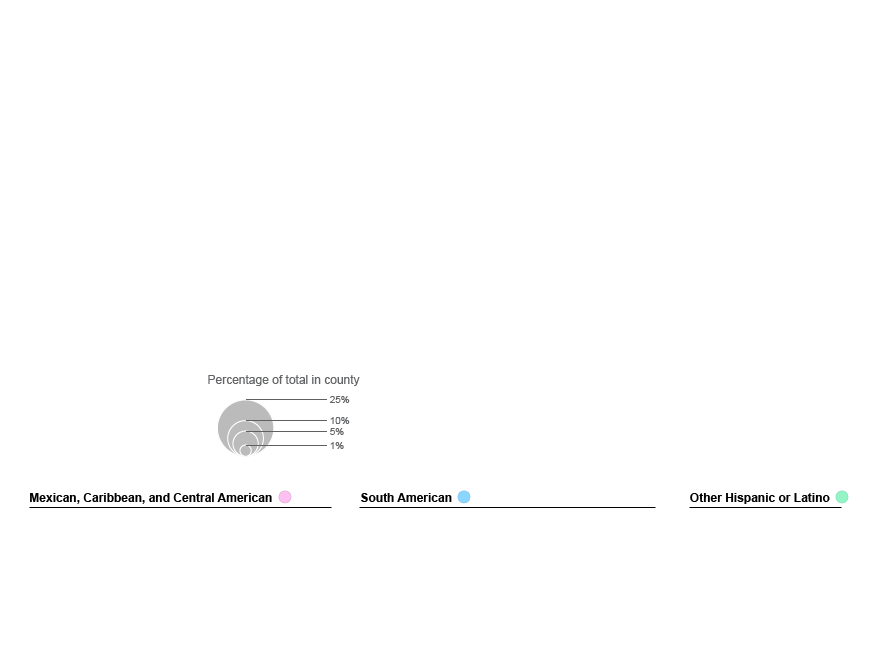
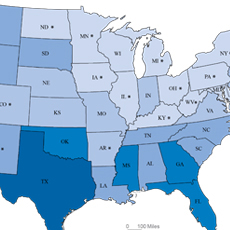
Within the larger category of Hispanic or Latino Origin, people responding to the Census questionnaire reported many different specific origins. The clustering and dispersion of people in those categories can be explored in this interactive graphic. The area of each circle shown reflects the proportion of the group that lives in a given county. Click on one of the 22 groups listed above to see its national distribution.
SOURCE: Powered by the Census API, Census 2010 SF1 table PCT11
NOTE: Data are for counties. Data are not shown for counties with fewer than 1,000 people in a given group. Data for Puerto Rico are not included. For more information on accessing data through Census APIs, see www.census.gov/developers/. For more information on Hispanic or Latino Origin, see www.census.gov/topics/population/hispanic-origin.html.
Recent Data Visualizations
 Population Without Health Insurance
 Population Bracketology
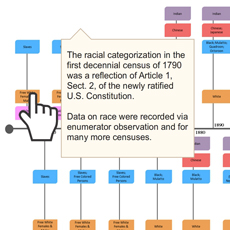 Measuring Race and Ethnicity Across the Decades: 1790-2010
 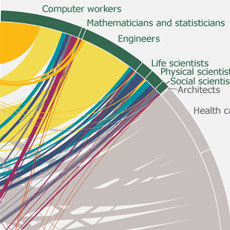 Where do college graduates work?
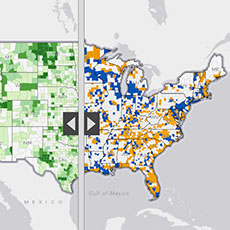 Story Maps Illustrate Population Change
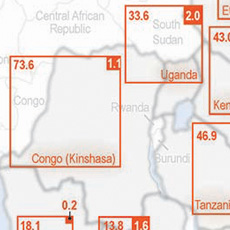 HIV/AIDS Impact in Africa
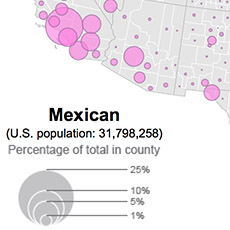 Distribution of Hispanic or Latino Population by Specific Origin: 2010
 A Century of Population Change in the Age and Sex Composition of the Nation
  Shifting Occupational Shares
 Metro Area Density
 Work-Life Earnings
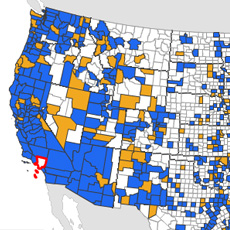 Census Flows Mapper
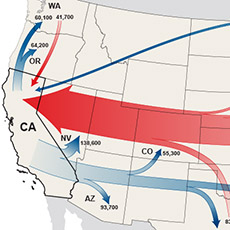 Migration Between Calif. & Other States
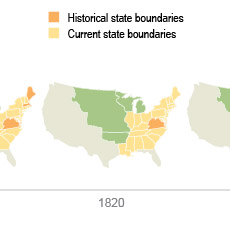 U.S. Territory and Statehood Status
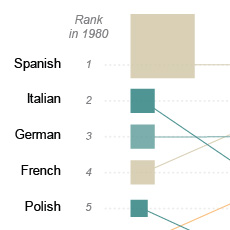 Spoken Languages Other than English
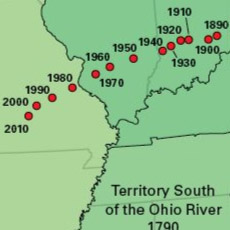 Center of Population, 1790-2010
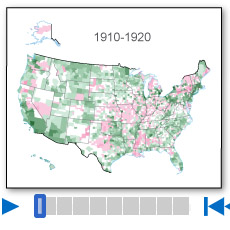 Population Change by Decade
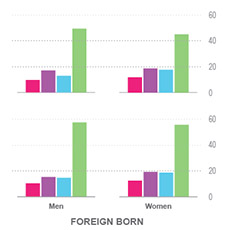 Without A High School Education
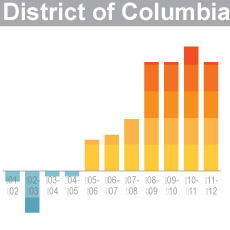 A Decade of State Population Change
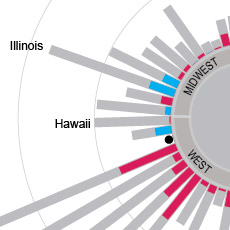 State-to-State Migration for States of 8 Million or More
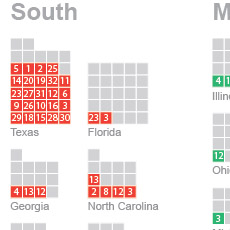 Population Under 5 Years Old by Congressional District
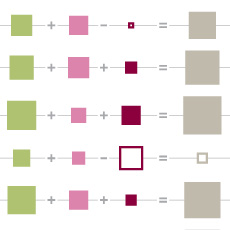 Components of Metro Area Change
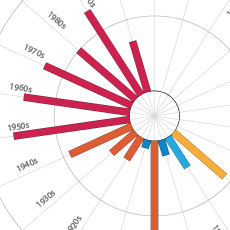 Blooming States
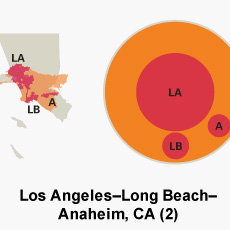 Coastline County Population
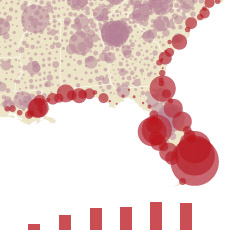 Coastline County Population
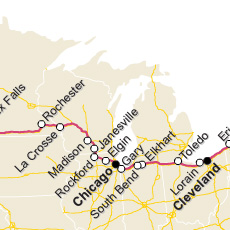 I-90 Population Density Profile, 2010
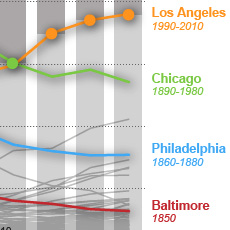 Second Cities: Keeping Pace with a Booming New York
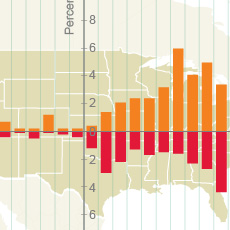 By the Grid: Population Shift to the West and South
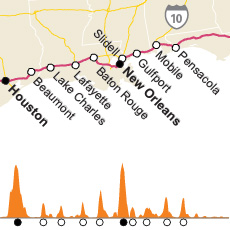 I-10 Population Density Profile, 2010
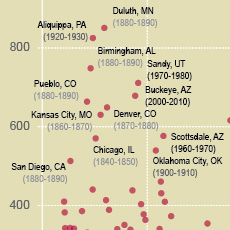 Booming Cities Decade-to-Decade, 1830-2010
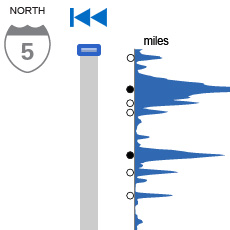 I-5 Population Density Profile, 2010
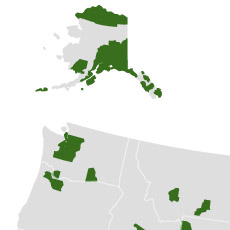 Islands of High Income
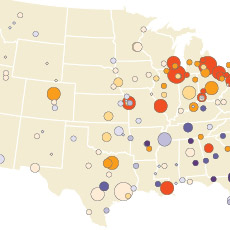 The Great Migration, 1910 to 1970
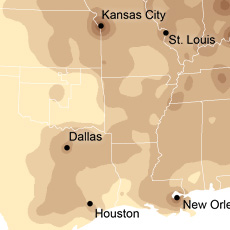 Following the Frontier Line, 1790 to 1890
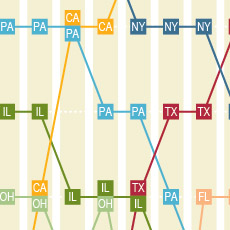 Changing Ranks of States by Congressional Representation
 Cartograms of State Populations in 1890, 1950, and 2010
 Before and After 1940: Change in Population Density
 From Physical to Political Geography
 Differential City Growth Patterns
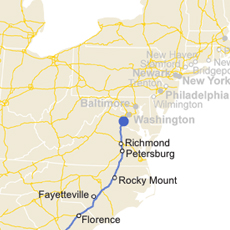 I-95 Population Density Profile
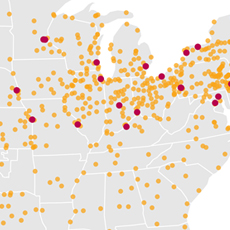 Increasing Urbanization
 Gaining and Losing Shares
 Top 20 Cities

