
Official websites use .gov
A .gov website belongs to an official government organization in the United States.
Secure .gov websites use HTTPS
A lock (
) or https:// means you’ve safely connected to the .gov website. Share sensitive information only on official, secure websites.

Topics
Data & Maps
Surveys & Programs
Resource Library
Health Insurance Coverage in the United States: 2017
Health Insurance Coverage in the United States: 2017
Report Number P60-264
Introduction

This report presents statistics on health insurance coverage in the United States based on information collected in the 2014, 2015, 2016, 2017, and 2018 Current Population Survey Annual Social and Economic Supplements (CPS ASEC) and the American Community Survey (ACS).
Highlights
• In 2017, 8.8 percent of people, or 28.5 million, did not have health insurance at any point during the year as measured by the CPS ASEC. The uninsured rate and number of uninsured in 2017 were not statistically different from 2016 (8.8 percent or 28.1 million).
• The percentage of people with health insurance coverage for all or part of 2017 was 91.2 percent, not statistically different from the rate in 2016 (91.2 percent). Between 2016 and 2017, the number of people with health insurance coverage increased by 2.3 million, up to 294.6 million.
• In 2017, private health insurance coverage continued to be more prevalent than government coverage, at 67.2 percent and 37.7 percent, respectively. Of the subtypes of health insurance coverage, employer-based insurance was the most common, covering 56.0 percent of the population for some or all of the calendar year, followed by Medicaid (19.3 percent), Medicare (17.2 percent), direct-purchase coverage (16.0 percent), and military coverage (4.8 percent).
• Between 2016 and 2017, the rate of Medicare coverage increased by 0.6 percentage points to cover 17.2 percent of people for part or all of 2017 (up from 16.7 percent in 2016).
• The military coverage rate increased by 0.2 percentage points to 4.8 percent during this time. Coverage rates for employment-based coverage, direct-purchase coverage, and Medicaid did not statistically change between 2016 and 2017.
• In 2017, the percentage of uninsured children under age 19 (5.4 percent) was not statistically different from the percentage in 2016.
• For children under age 19 in poverty, the uninsured rate (7.8 percent) was higher than for children not in poverty (4.9 percent).
• Between 2016 and 2017, the uninsured rate did not statistically change for any race or Hispanic origin group.
• In 2017, non-Hispanic Whites had the lowest uninsured rate among race and Hispanic-origin groups (6.3 percent). The uninsured rates for Blacks and Asians were 10.6 percent and 7.3 percent, respectively. Hispanics had the highest uninsured rate (16.1 percent).
• Between 2016 and 2017, the percentage of people without health insurance coverage at the time of interview decreased in three states and increased in 14 states.

Visualization
Population Without Health Insurance Coverage by State: 2008 to 2017
View populations without heath insurance coverage by state and year.
Visualization
Uninsured Rate by State: 2008 to 2017
View uninsured rates by state from 2008 to 2017.
Visualization
Type of Health Insurance Coverage Rate Change by State
View the type of health insurance coverage rate change by state, coverage type, and year.

Health Insurance Detailed Tables
Table
Current Population Survey Tables for Health Insurance Coverage
The Current Population Survey is a joint effort between the Bureau of Labor Statistics and the Census Bureau.
Table
American Community Survey Tables for Health Insurance Coverage
Additional health insurance tables using the American Community Survey (ACS).
CPS ASEC Research Files
Others in Series
Publication
Custodial Mothers and Fathers and Their Child Support: 2015
This report focuses on the child support income that custodial parents reported receiving from noncustodial parents living elsewhere and other types of support.
Publication
Income and Poverty in the United States: 2017
This report presents data on income, earnings, income inequality & poverty in the United States based on information collected in the 2017 and earlier CPS ASEC.
Publication
The Supplemental Poverty Measure: 2017
This report describes research on the Supplemental Poverty Measure (SPM).
Related Information
PUBLICATION
Health Insurance Publications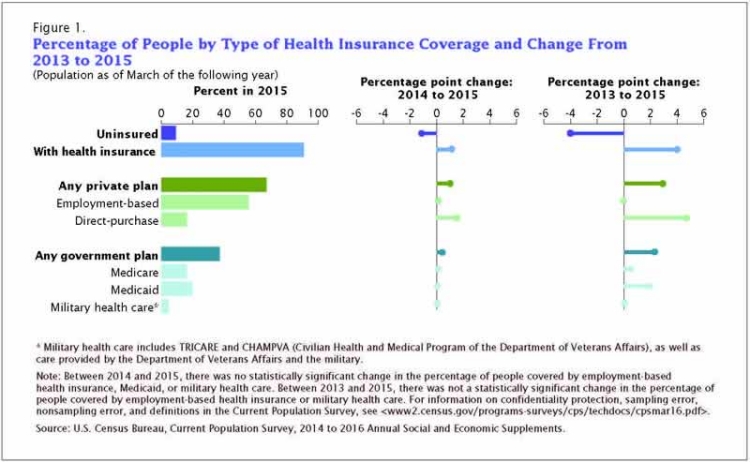
Page Last Revised - August 22, 2022
✕
Is this page helpful?
 Yes
Yes
 No
No
 Yes
Yes
 No
No✕
NO THANKS
255 characters maximum
 255 characters maximum reached
✕
Thank you for your feedback.
Comments or suggestions?

Comments or suggestions?