The Supplemental Poverty Measure: 2018
The Supplemental Poverty Measure: 2018
Introduction

Since the publication of the first official U.S. poverty estimates, researchers and policymakers have continued to discuss the best approach to measure income and poverty in the United States. Beginning in 2011, the Census Bureau began publishing the Supplemental Poverty Measure (SPM), which extends the official poverty measure by taking account of many of the government programs designed to assist low-income families and individuals that are not included in the official poverty measure. This is the ninth report describing the SPM, released by the U.S. Census Bureau, with support from the Bureau of Labor Statistics (BLS). This report presents updated estimates of the prevalence of poverty in the United States using the official measure and the SPM based on information collected in 2019 and earlier Current Population Survey Annual Social and Economic Supplements (CPS ASEC).
Highlights
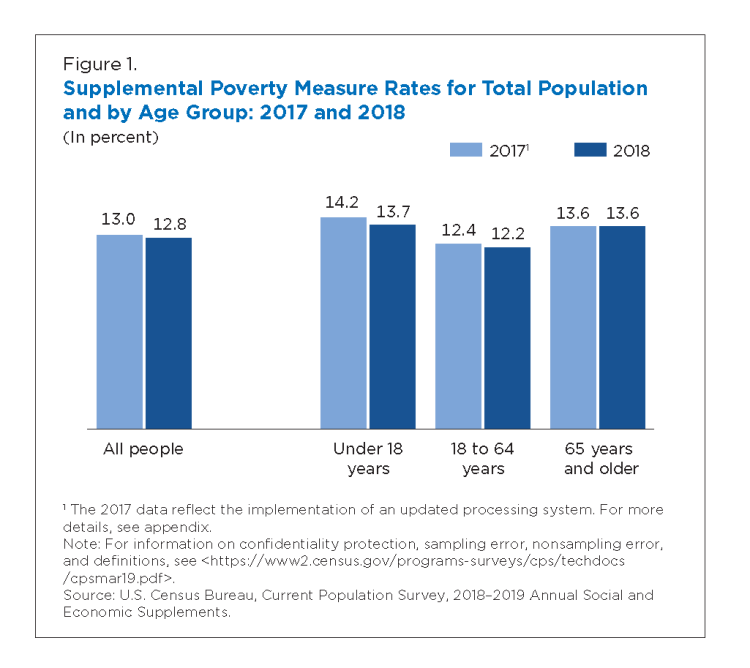
- In 2018, the overall SPM rate was 12.8 percent. This is not statistically different from the 2017 SPM rate of 13.0 (Figure 1).
- SPM rates were not statistically different for any of the major age categories in 2018 compared with 2017. SPM rates for children under the age of 18 were 13.7 percent, which is not significantly different than 14.2 percent in 2017 (Figure 1 and Figure 2).
- The SPM rate for 2018 was 1.0 percentage points higher than the official poverty rate of 11.8 percent (Figure 3).
- Social Security continued to be the most important anti-poverty program, moving 27.2 million individuals out of poverty. Refundable tax credits moved 8.9 million people out of poverty (Figure 8).
Erratum
Due to an error in our tax model, tax units with an Adjusted Gross Income (AGI) below $12,000 were inadvertently not run through the Additional Child Tax Credit (ACTC) portion of the tax model. As a result, 2,435 tax units did not receive this refundable credit, which changed the Supplemental Poverty Measure (SPM) poverty status of about 600 individuals (or 0.3% of the weighted population). This error changed our top-level SPM estimate from 13.1% for 2018 to 12.8%. Using either set of estimates, the change between 2017 and 2018 was not significant overall or for any of the major age categories. All SPM estimates have been revised accordingly.
Figures

Tables

Others in Series
Visualization
Publication
Publication
Related Information