Voter Turnout Rates Among All Voting Age and Major Racial and Ethnic Groups Were Higher Than in 2014
The November 2018 election is widely recognized for its high voter turnout. Census Bureau data released today show who is behind the historic 11 percentage point increase from the last midterm election in 2014.
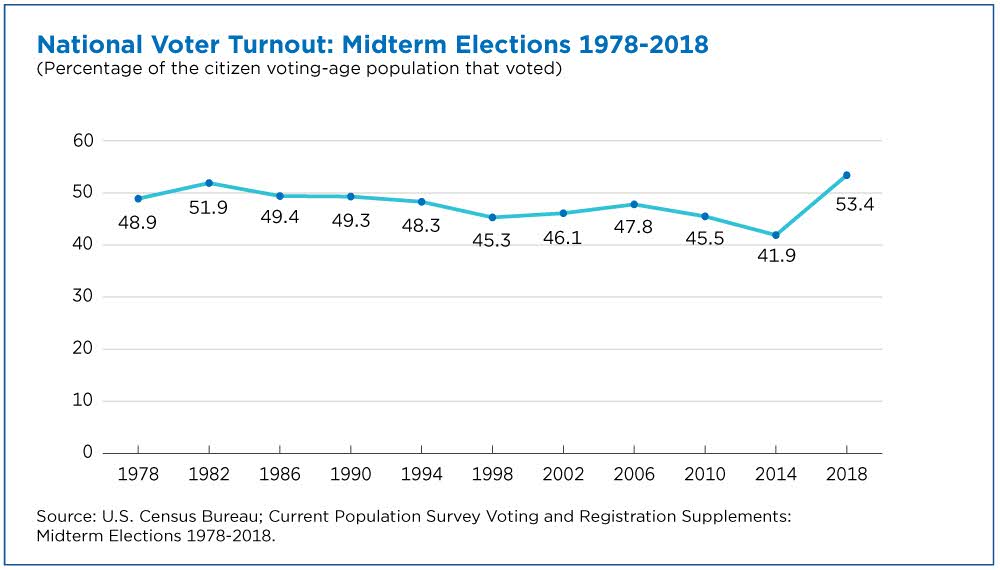
Voter turnout went up among all voting age and major racial and ethnic groups. Fifty-three percent of the citizen voting-age population voted in 2018, the highest midterm turnout in four decades, while the 2014 election had the lowest.
Among 18- to 29-year-olds, voter turnout went from 20 percent in 2014 to 36 percent in 2018, the largest percentage point increase for any age group — a 79 percent jump.
Data from the Current Population Survey’s Voting and Registration Supplement out today provide insight into the characteristics of those that cast their ballots in this record-breaking midterm election.
Who is Behind the Historic Increase?
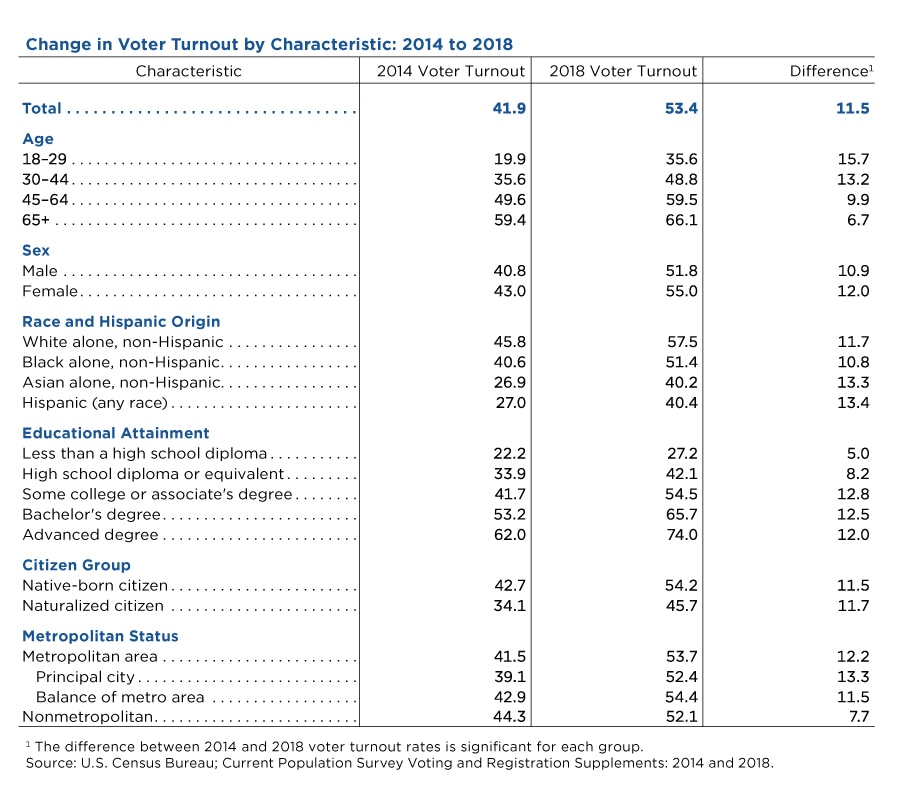
Voter turnout went up more in some groups than others from 2014 to 2018:
- Among 18- to 29-year-olds, voter turnout went from 20 percent in 2014 to 36 percent in 2018, the largest percentage point increase for any age group — a 79 percent jump.
- Among men and women, voter turnout increased by 11 and 12 percentage points respectively.
- Voter turnout increased among non-Hispanic Asians by 13 percentage points, a 49 percent increase.
- Among Hispanics, voter turnout increased by 13 percentage points, a 50 percent increase in Hispanic voter turnout.
- Non-Hispanic black voter turnout increased by 11 percentage points.
- Those with higher levels of education had higher levels of voter turnout in 2018. Those with less than a high school education had the smallest increase in voter turnout (5 percentage points). Those with a high school diploma or equivalent had the second-lowest increase (8 percentage points).
- Voting by native-born and naturalized citizens both increased by 12 percentage points. This increase is not significantly different between native-born and naturalized citizens.
- Unlike the 2014 midterm election, voter turnout among those living in nonmetropolitan areas (up 8 points) was lower than for those living in metropolitan areas (up 12 points).
Gender Gap
A record number of women were elected to the House of Representatives in the November 2018 election. Additionally, women continued to vote at higher rates than men, just as they have in every midterm election since 1998.
In the 2018 midterm election, 55 percent of women voted compared with 52 percent of men, a 3 percentage point gap.
Census Bureau voting and registration data also include a detailed table package of key estimates, which allows data users to take a deeper dive into the numbers behind elections.
Estimates in the 2018 Election table package show that the difference between male and female voter turnout varied among different demographic groups.
Gender Gap by Age
While younger women voted at higher rates than younger men, women age 65 and older voted at lower rates than men in the same age range.
In 2018, among those age 65 and older, voter turnout was 65 percent for women and 68 percent for men. In contrast, 38 percent of women 18-29 years old voted and 33 percent of men of the same age group voted.
Gender Gap by Race and Hispanic Origin
Voter turnout for non-Hispanic black women was 55 percent, compared with 47 percent for non-Hispanic black men, an 8 percentage point gap.
Hispanic women voted at higher rates than Hispanic men, with 2018 voter turnout rates of 43 percent and 37 percent, respectively.
The difference between male and female turnout was two percentage points among non-Hispanic whites. The difference between male and female turnout was not significantly different among non-Hispanic Asians.
Gender Gap by Employment Status
In 2018, 49 percent of unemployed women and 40 percent of unemployed men voted, a 9 percentage point difference.
The gap between employed men and women is smaller than the gap between unemployed men and women. In 2018, 57 percent of employed women voted compared with 52 percent of employed men.
Among those who were not in the labor force, 53 percent of women voted compared with 51 percent of men.
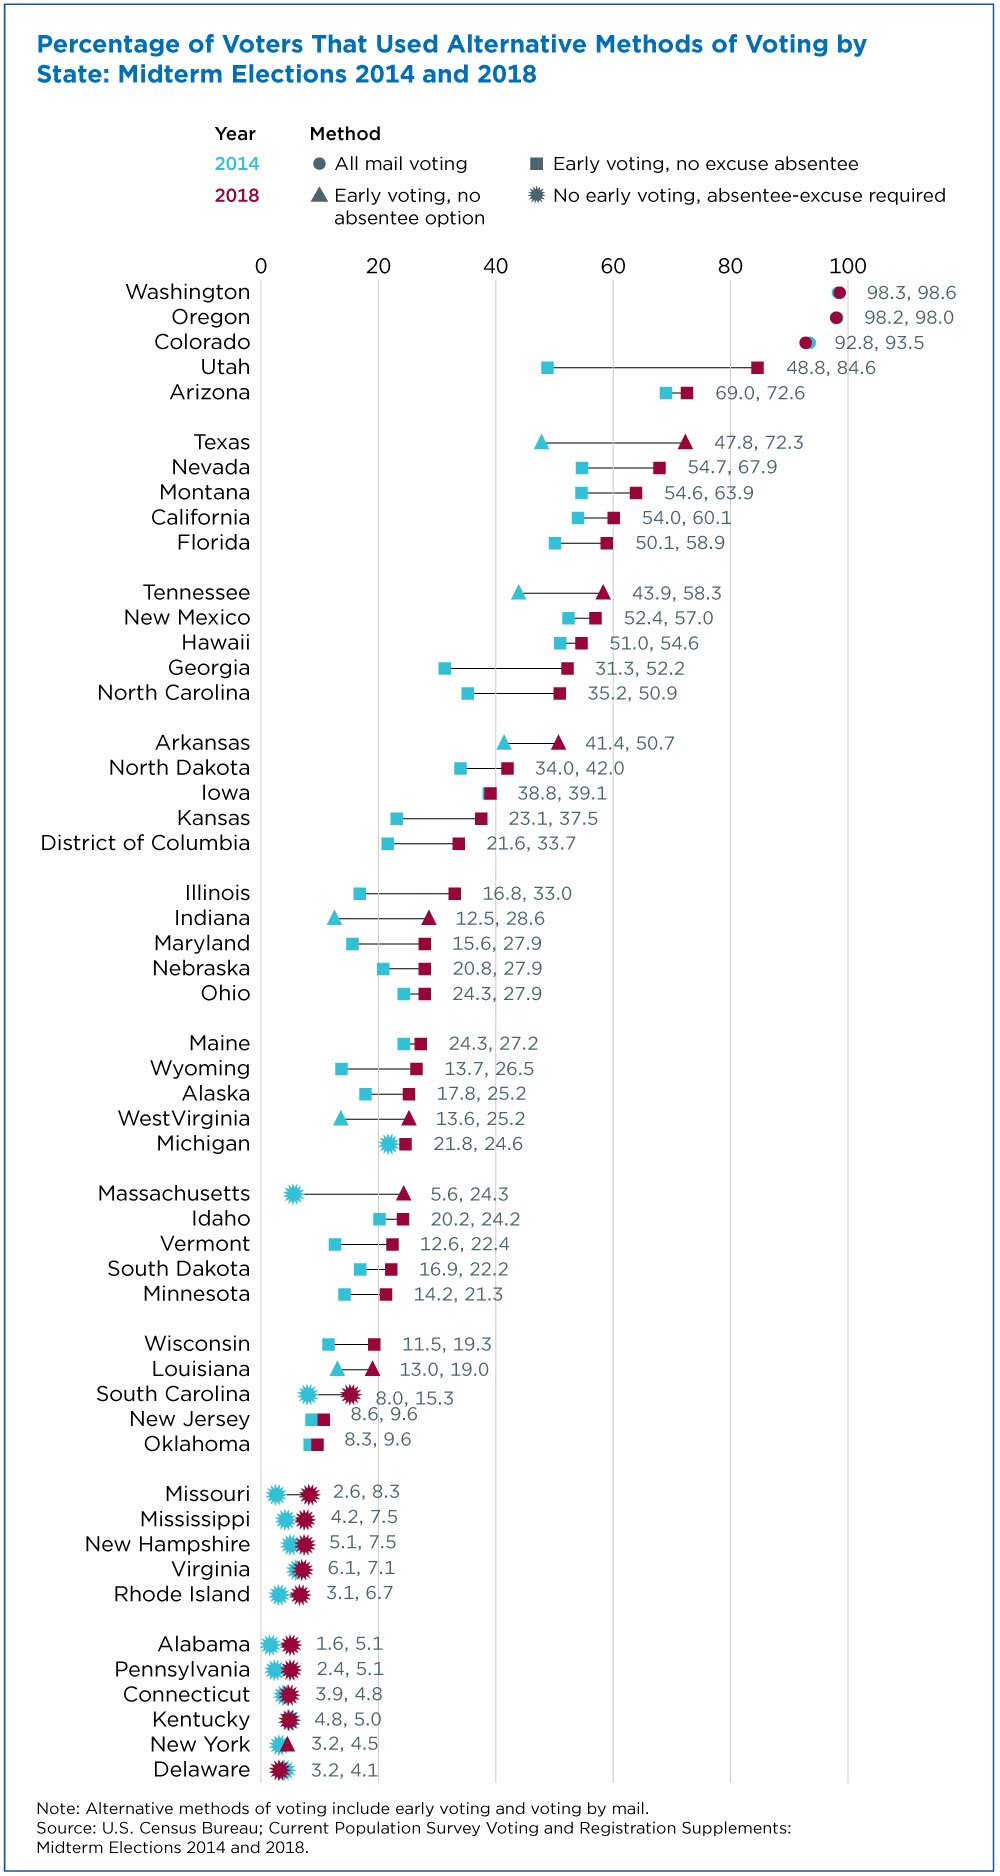
Alternative Voting
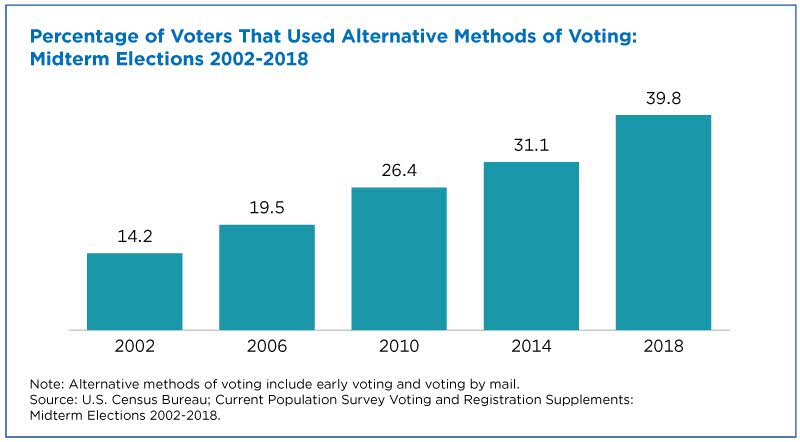
The availability of alternative voting methods continues to change how voters vote. Alternative voting methods include any method other than voting in person on Election Day, such as early voting and voting by mail.
In 2018, 40 percent of voters used an alternative voting method. The percentage of voters that cast their ballot early or by mail usually declines slightly in midterm elections relative to the preceding presidential election. However, the rate in 2018 was not significantly different from the 2016 presidential election.
The use and availability of alternative voting methods varied by state. In the 2018 election, early voting was available in 39 states. Some states require that voters state a reason or excuse for mailing an absentee ballot, while others do not (no-excuse absentee voting). Three states (Washington, Oregon and Colorado) have all-mail voting systems.
The three states with the highest percentage point increases in alternative voting rates from 2014 were Utah, Texas and Georgia. Alternative voting increased by 36 percentage points in Utah, 25 points in Texas, and 21 points in Georgia.
This high increase in alternative voting in these states is likely the result of Utah’s ballot initiatives and expanded mail voting opportunities, and the high-profile elections in Texas and Georgia.
States without the option to vote early and those that require voters to provide an excuse for voting absentee, had some of the lowest alternative voting rates in the country.
Subscribe
Our email newsletter is sent out on the day we publish a story. Get an alert directly in your inbox to read, share and blog about our newest stories.
Contact our Public Information Office for media inquiries or interviews.
-
GovernmentExplore My Congressional District Data ToolMarch 27, 2019Interest in the My Congressional District tool peaked after the midterm elections and is expected to continue now that the new Congress is sworn in.
-
PopulationMillennials Are Helping Philadelphia ReboundSeptember 27, 2017Philadelphia's population had fallen to its lowest levels since 1900. Millennials now are key to Philadelphia's population turnaround.
-
PopulationVoter Turnout for Non-Hispanic Black Population DeclinesAugust 09, 2017For only the second time since 1980, the share of non-Hispanic white voters did not drop since the last presidential election.
-
PopulationU.S. Fertility Continues to Drop but Still High in Some CountiesJune 25, 2026Counties with the highest numbers of births have some of the lowest fertility rates.
-
TaxationFundamental Shifts in State Taxes in Past CenturyJune 17, 2026Income and sales taxes have largely replaced property taxes, once the lion’s share of state tax revenue.
-
HousingHelping You Decide Where to Buy a HomeJune 10, 2026Census Bureau resources help homebuyers find the best locations for their needs.
-
Population2026 World Cup Teams Will Have Home Crowds Among U.S. Foreign-BornJune 09, 2026Census data show which of the 48 countries in the World Cup have the largest foreign-born fan bases in the United States and where they live.