Births Now Outpacing Deaths in Over Half the States
Births in 2023 once again began to outpace deaths in over half of U.S. states as mortality declined, inching closer to pre-pandemic levels, according to U.S. Census Bureau population estimates released today.
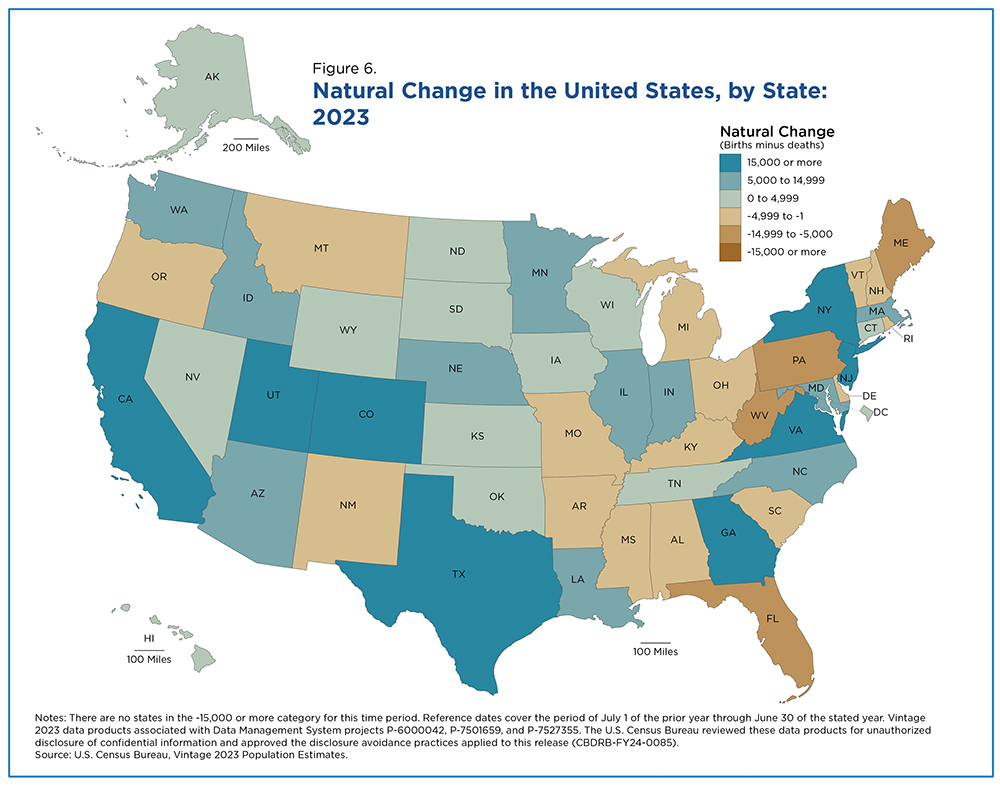
By July 1, 2023, natural change had rebounded slightly with only 19 states experiencing natural decrease, according to provisional data. And the South and the Northeast returned to being the regions with the most states with more deaths than births, although the levels were still much lower than during the two previous periods.
Natural increase (more births than deaths) had been on the decline since 2020 and more states had natural decrease (more deaths than births) in the first years of the decade than at any point in the 2010s, driven largely by mortality hikes combined with smaller decreases in births.
Areas with large older populations often experience natural decrease and shrinking populations in the absence of migration. Prior to 2020, natural increase for the United States hovered around one million a year. It began declining in 2020 but this national trend obscured widespread natural decrease at the state level since the beginning of the decade.
In the 2010s, only four states (Maine, New Hampshire, Vermont and West Virginia) consistently had more deaths than births. But from 2020 to 2021 and 2021 to 2022, half of all states experienced natural decrease. While 19 states rebounded slightly, 15 — mostly in the South — experienced natural decrease during all estimates periods between April 1, 2020 (Census Day) and July 1, 2023.
Measuring Births and Deaths
The decennial census counts the nation’s population as of Census Day or April 1, the first year of each decade. The annual population estimates measure the population as of July 1. However, references to birth, death and migration events typically cover the period of July 1 of the prior year through June 30 of the stated year. For example, the estimate of births for 2022 would cover total births from July 1, 2021, to June 30, 2022.
Whenever possible, we base the births and deaths in our annual estimates series on final data from the National Center for Health Statistics (NCHS).
For this latest series of estimates, known as Vintage 2023, the last year of final data available from NCHS was 2021. To capture recent trends in births and deaths in the estimates series (April 1, 2020, to June 30, 2023) we relied on provisional monthly state totals. The data are not final and are subject to revision. That means the patterns we describe may differ from those in our next vintage of estimates (Vintage 2024), which will be updated with final data.
U.S. Births and Deaths
The patterns in natural change (births minus deaths) for 2020-2023 contrasted with the previous decade, likely a result of the COVID-19 pandemic which began in 2020.
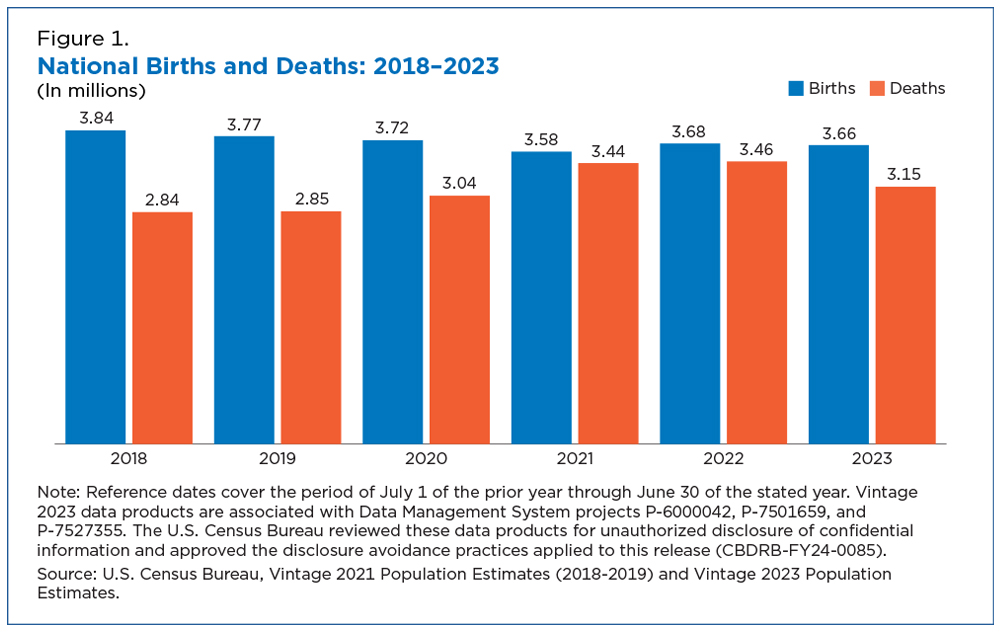
Throughout the 2010s, annual levels of births and deaths gradually changed. Births declined slightly each year, with the exception of 2014. In the last two years of the decade, births decreased more than they had previously, but still hovered between 3.7 and 3.8 million (Figure 1).
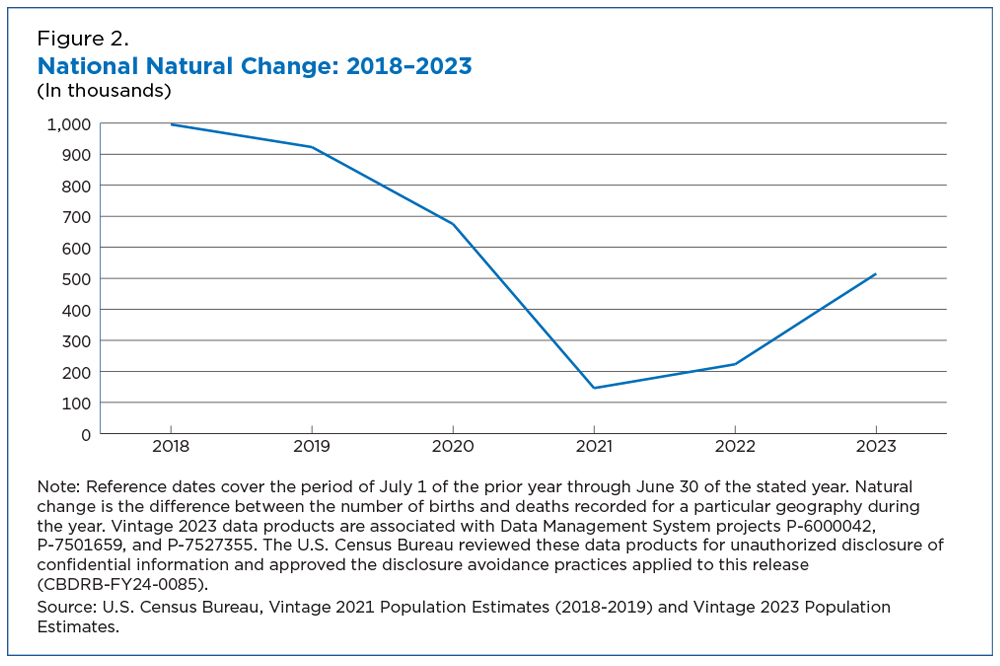
There were predictable changes in deaths, which increased on average by 1.9% between 2014 and 2019. This resulted in small drops in natural increase each year, although it still hovered around 1 million in the two years prior to the start of the new decade (Figure 2).
In 2020, natural increase fell nearly 27% to 674,541. This mostly stemmed from a jump in COVID-19 deaths although births dipped by 1.4% during the same period. The pandemic was declared a national emergency in March of 2020 and the COVID-19 impacts on births would not have been seen until December.
Natural increase plunged by nearly 79% to just 144,013 in 2021, indicating there were only 144,013 more births than deaths that year. Again, this was mostly caused by a hike (13%) in mortality but births also slid by 3.5% that year.
Provisional NCHS data from 2022 and 2023 reveal that natural increase began rebounding somewhat: it was 236,155 in 2022 and 531,432 in 2023, thanks to an increase in births and fewer deaths. But it was still well below levels last decade.
State-Level Natural Decrease
Prior to the start of the decade, only a handful of states — Maine, New Hampshire, Vermont and West Virginia — consistently had more deaths than births, and they all had, on average, older populations.
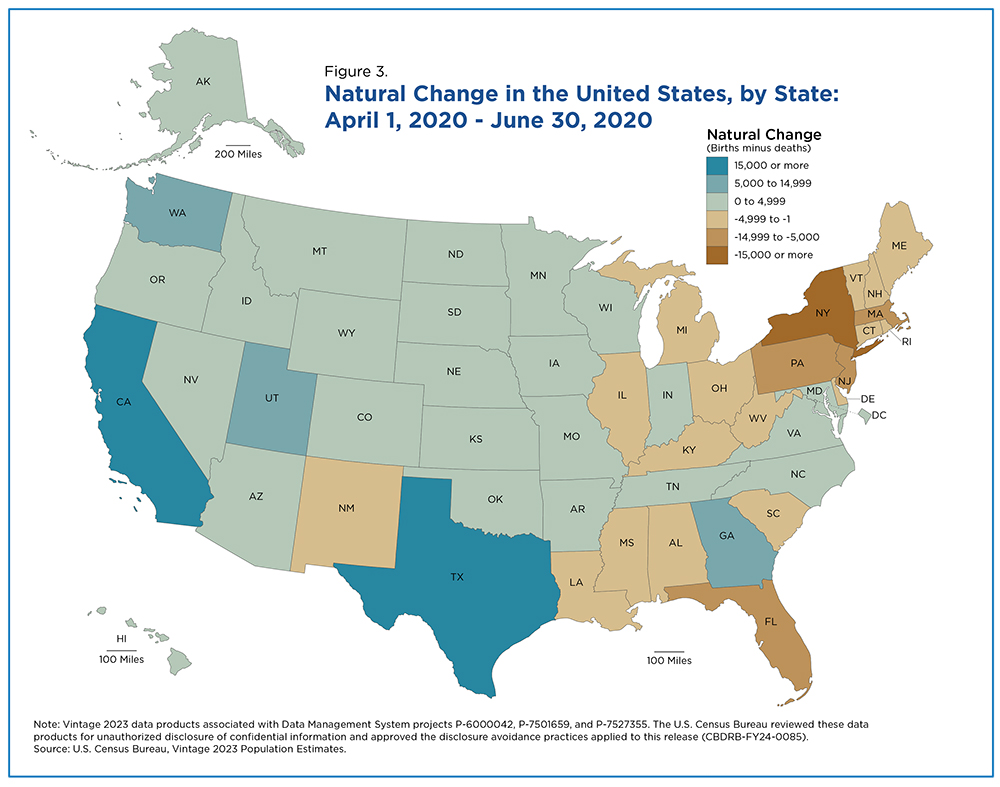
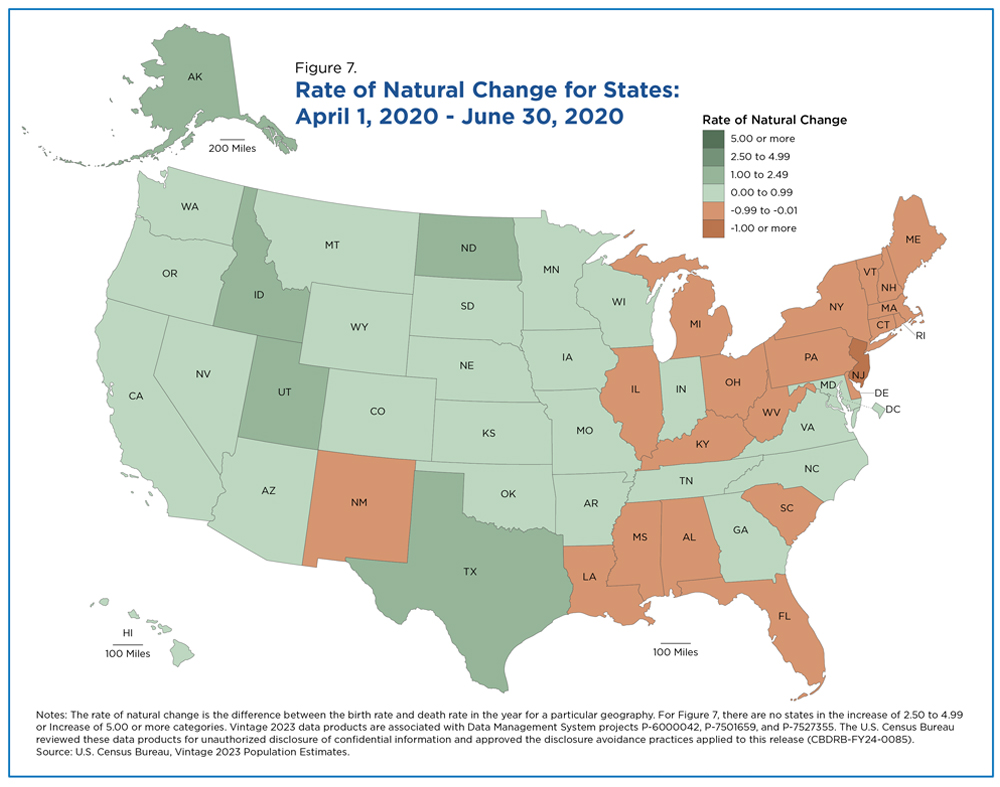
By contrast, 21 states experienced natural decrease in the three months from April 1 to June 30, 2020 (Figure 3), the first months of the pandemic.
Natural decrease occurred in many states in the Northeast and South. New York (-19,642), New Jersey (-9,244), Pennsylvania (-7,386), Florida (-6,089) and Massachusetts (-5,020) had the highest levels of natural decrease. The main culprit: increases in deaths due to COVID-19. As mentioned earlier, births would not have been impacted until later in 2020.
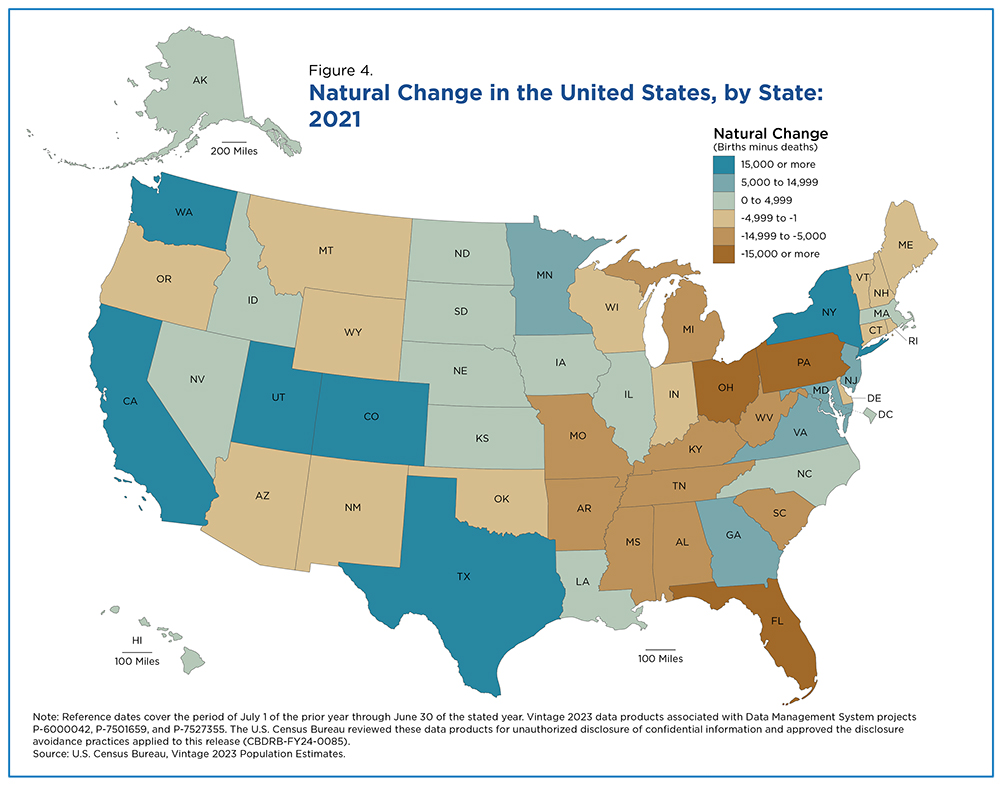
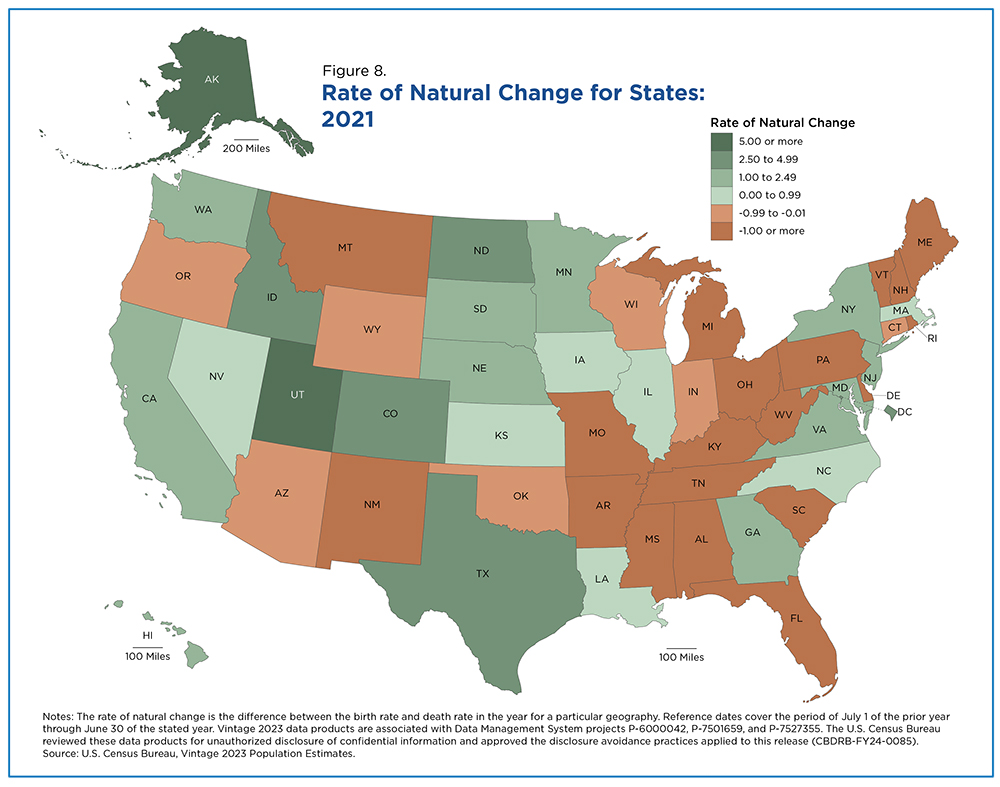
In 2021, 26 states had natural decrease — 10 in the South, six in the Northeast, and five each in the Midwest and West (Figure 4).
Natural decrease spread across U.S. regions as the COVID-19 pandemic persisted. Florida (-42,447) had the highest natural decrease caused predominantly by an uptick in mortality (almost 17% from the previous estimate year) exacerbated by a decline (4.3%) in births.
Eleven states with natural increase during the first period flipped to natural decrease: Arizona, Arkansas, Connecticut, Indiana, Missouri, Montana, Oklahoma, Oregon, Tennessee, Wisconsin and Wyoming. Like Florida, the major cause in most states, especially those with the largest decreases, stemmed from an increase in mortality and smaller drop in births.
New Hampshire was the only state with natural decrease that had an increase in births (157; 1.3%).
New York went from having the highest natural decrease in 2020 (Figure 3) to natural increase in 2021 — 28,326 — (Figure 4) mainly due to a drop in deaths between estimates periods. Illinois, Louisiana, Massachusetts and New Jersey also switched to natural increase. In Illinois and Louisiana, there were enough births to outweigh the increase in deaths by 2021. In Massachusetts and New Jersey, mortality drops drove the shift to natural increase.
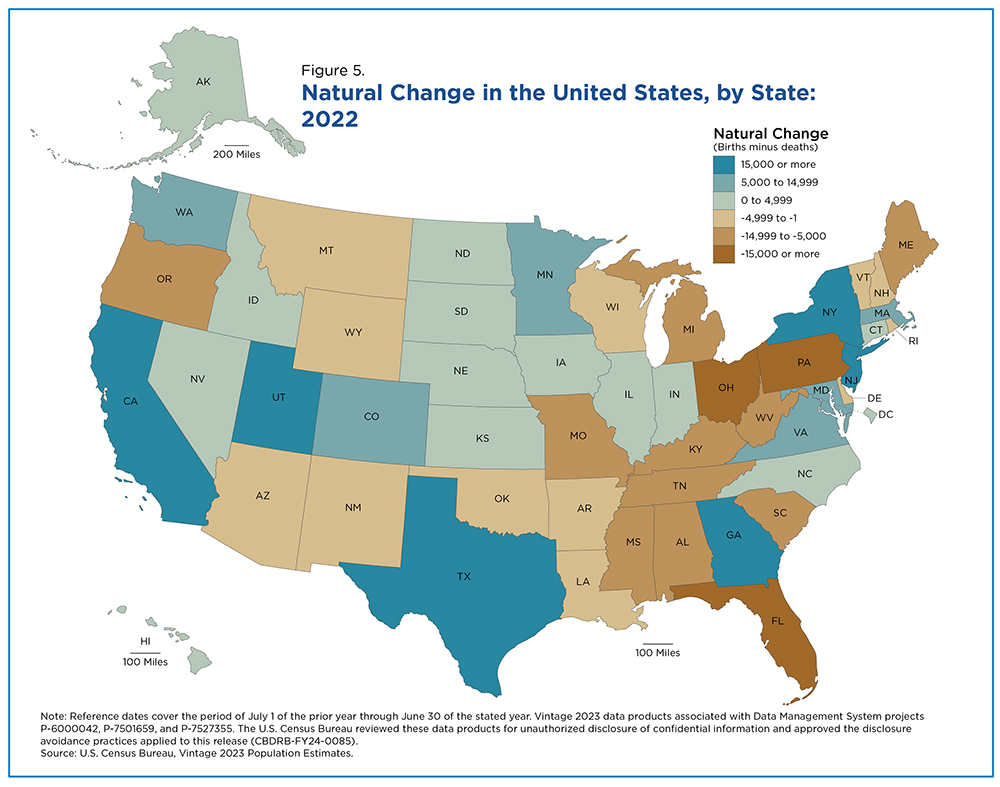
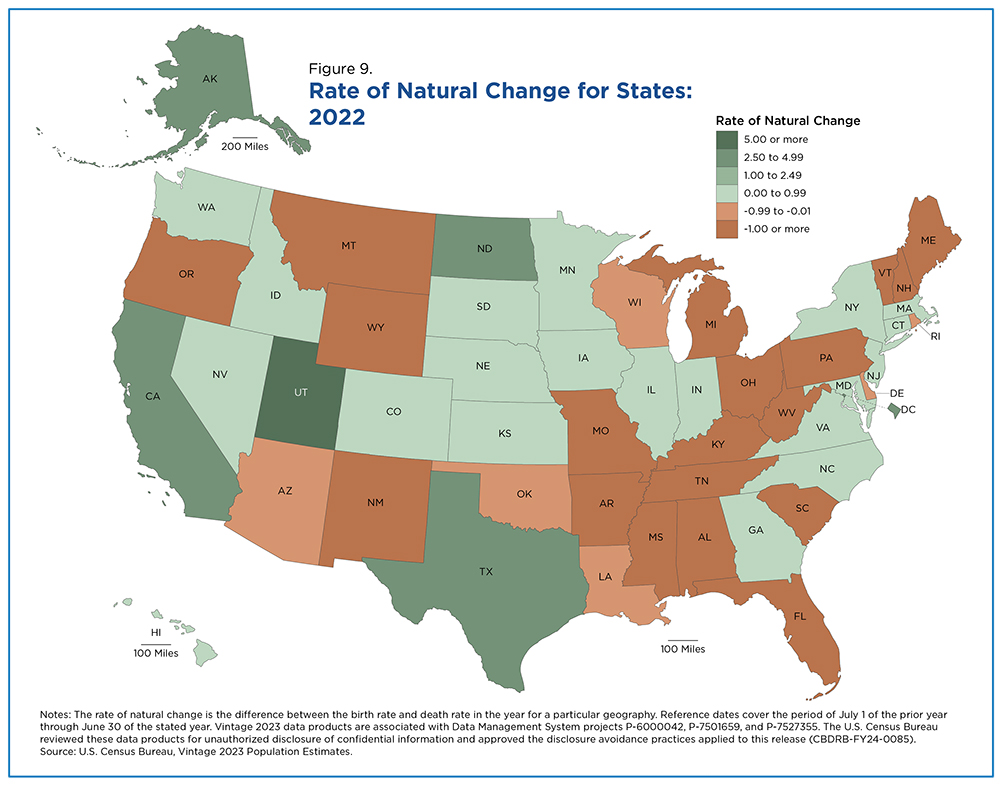
Twenty-five states had natural decrease in 2022 (Figure 5). The patterns were broadly similar to those in 2021 (Figure 4), but the levels of natural change shifted — natural decrease was higher in many states such as Arkansas, Maine, Oregon and so was natural increase (Georgia, New Jersey, Washington).
Natural change patterns reversed in only three states during this period: Connecticut and Indiana had natural increase due to the gains in births that overcame the steady small rise in deaths. Louisiana returned to having natural decrease (-335), since births remained slightly lower than mortality.
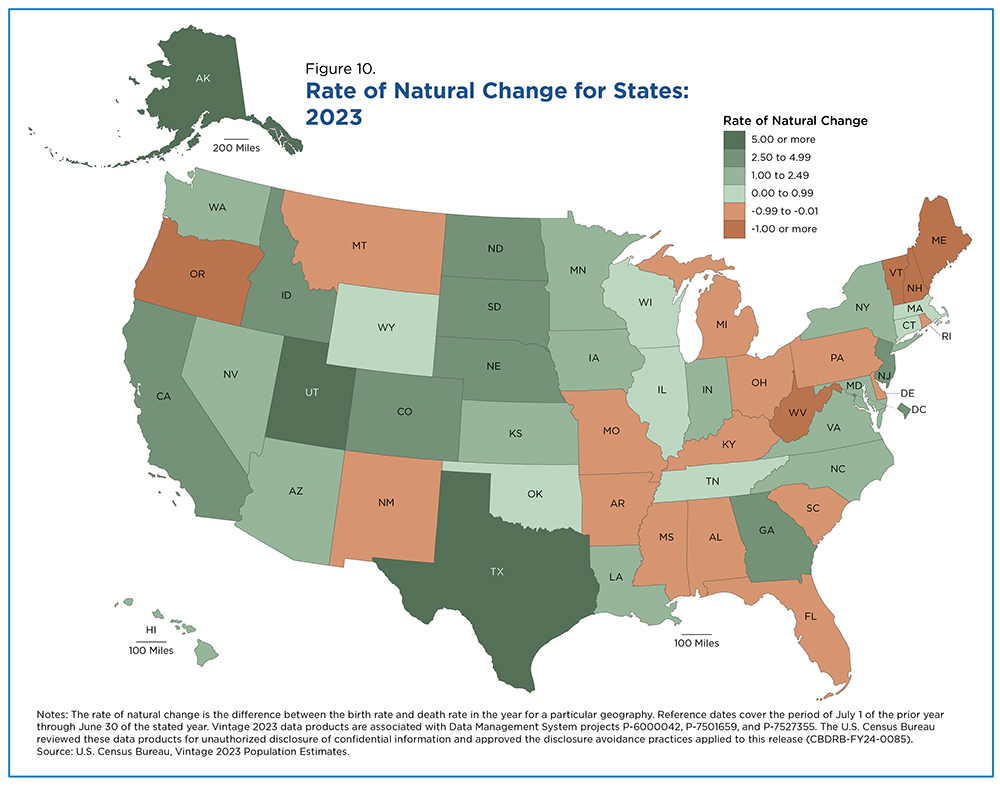
By July 1, 2023, natural change had rebounded slightly with only 19 states experiencing natural decrease, according to provisional data (Figure 6). And the South and the Northeast returned to being the regions with the most states with more deaths than births, although the levels were still much lower than during the two previous periods.
Six states switched from having natural decrease to increase: Arizona, Louisiana, Oklahoma, Tennessee, Wisconsin and Wyoming. The change was driven by a decrease in mortality in these states of at least 10% (except in Wisconsin where it was approximately 8%).
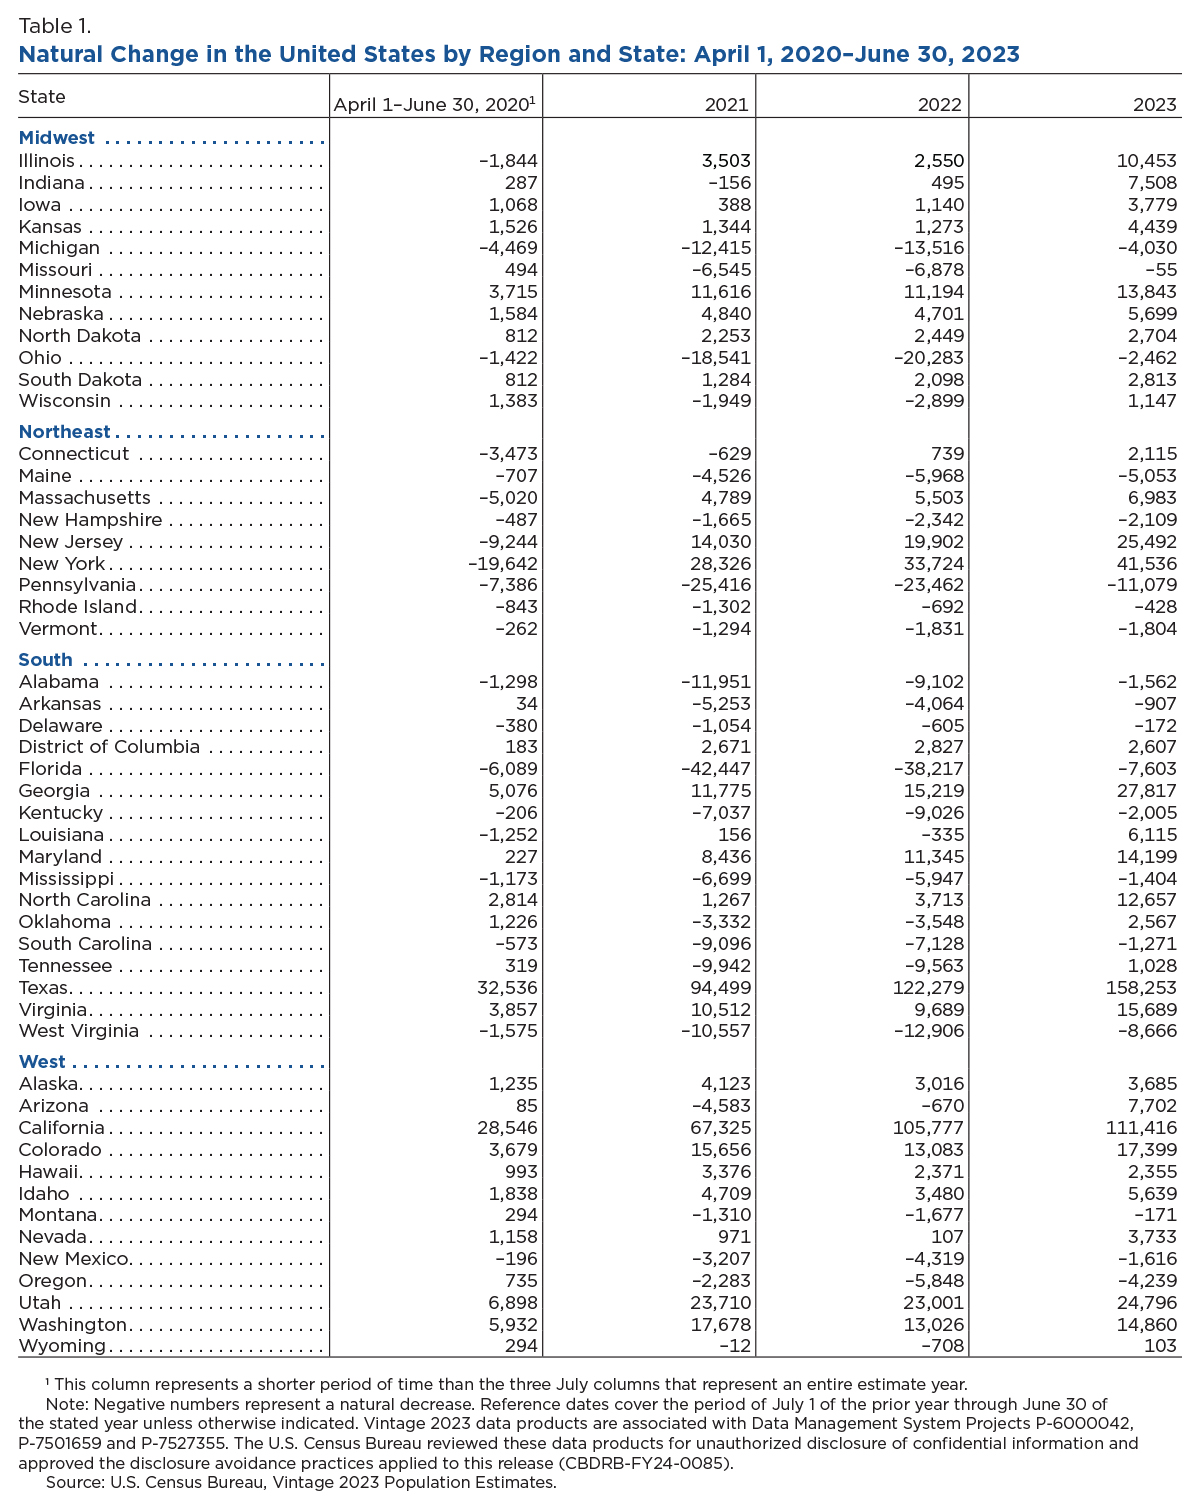
Fifteen states had natural decrease during all four periods between April 1, 2020, and June 30, 2023 (Table 1):
- Nearly half were in the South: Alabama, Delaware, Florida, Kentucky, Mississippi, South Carolina and West Virginia.
- Five were in the Northeast: Maine, New Hampshire, Pennsylvania, Rhode Island and Vermont.
- Two states were in the Midwest (Michigan and Ohio) and one in the West (New Mexico).
Impact of COVID-19
The data released today offer the most comprehensive look to date at the impact of COVID-19 mortality on the Census Bureau’s annual population estimates series.
The latest estimates (July 1, 2023) show a rebound in natural increase compared to prior years, but to levels still well below those at the end of last decade.
As more final data become available, we will be better able to evaluate the pandemic’s effect on natural change after the Vintage 2023 Population Estimates by county are released in March 2024.
Related Statistics
Stats for Stories
Subscribe
Our email newsletter is sent out on the day we publish a story. Get an alert directly in your inbox to read, share and blog about our newest stories.
Contact our Public Information Office for media inquiries or interviews.


