An official website of the United States government
Here’s how you know
Official websites use .gov
A .gov website belongs to an official government organization in the United States.
Secure .gov websites use HTTPS
A lock (
) or https:// means you’ve safely connected to the .gov website. Share sensitive information only on official, secure websites.
-
//
- Census.gov /
- Census Infographics & Visualizations /
- Housing Unit Percentage Change: 2018 to 2019 in Historical Context
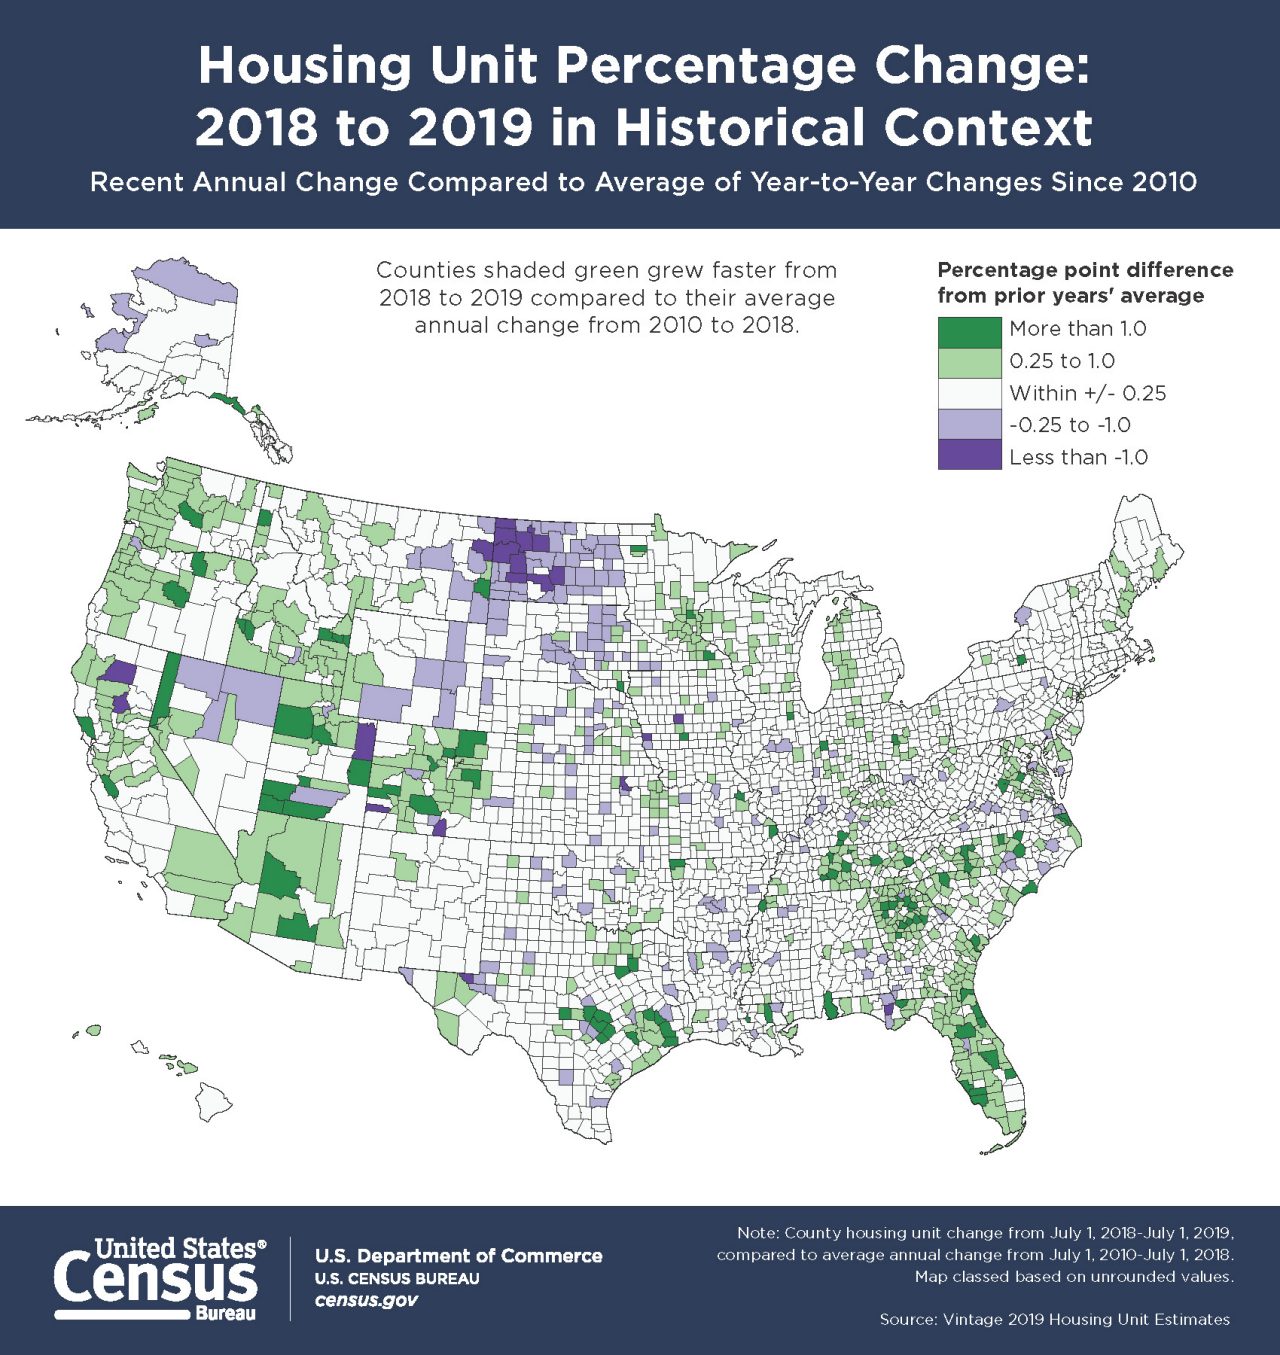
Housing Unit Percentage Change: 2018 to 2019 in Historical Context
Housing Unit Percentage Change: 2018 to 2019 in Historical Context
Share
Sources and Reference
Note: County housing unit change from July 1, 2018-July 1, 2019, compared to average annual change from July 1, 2010-July 1, 2018. Map classed based on unrounded values.
Source: Vintage 2019 Housing Unit Estimates
 Yes
Yes
 No
NoComments or suggestions?


Top


