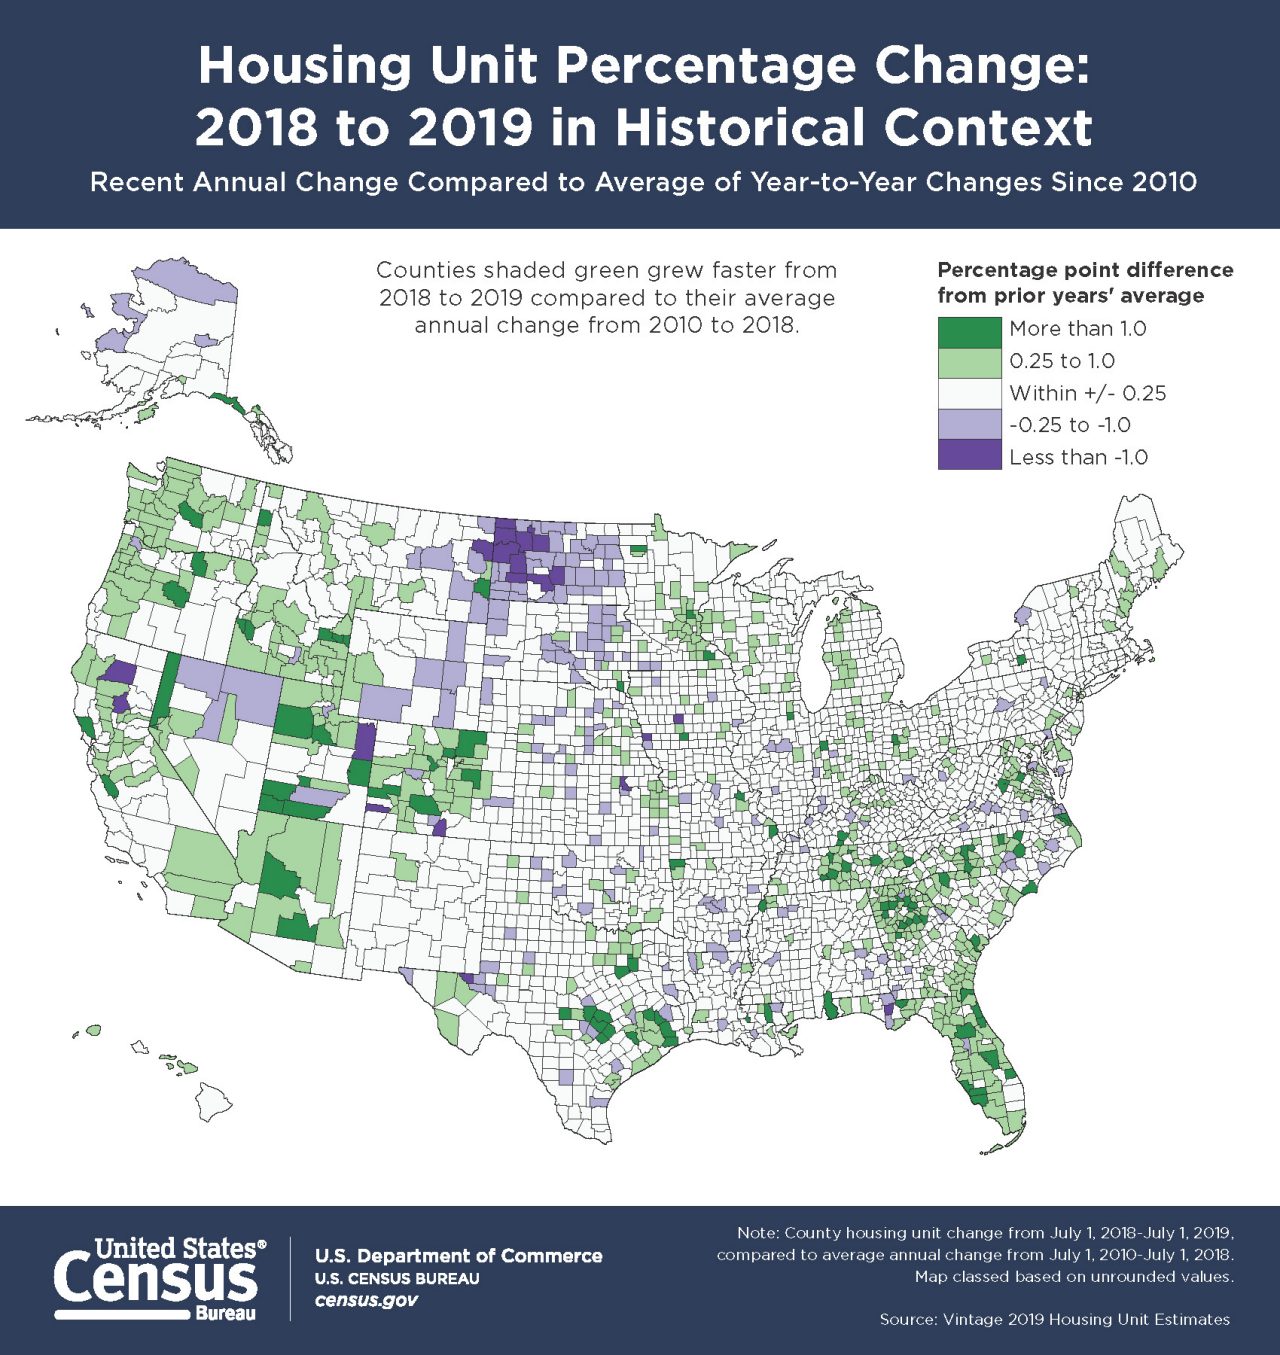
Housing Unit Percentage Change: 2018 to 2019 in Historical Context
Housing Unit Percentage Change: 2018 to 2019 in Historical Context
Download or Print this Graphic:
Sources and Reference
Note: County housing unit change from July 1, 2018-July 1, 2019, compared to average annual change from July 1, 2010-July 1, 2018. Map classed based on unrounded values.
Source: Vintage 2019 Housing Unit Estimates
Page Last Revised - October 8, 2021


