Health Insurance Coverage in the United States: 2016
Health Insurance Coverage in the United States: 2016
Report Number: P60-260
Introduction

This report presents statistics on health insurance coverage in the United States based on information collected in the 2014, 2015, 2016, and 2017 Current Population Survey Annual Social and Economic Supplements (CPS ASEC) and the American Community Survey (ACS).
Highlights
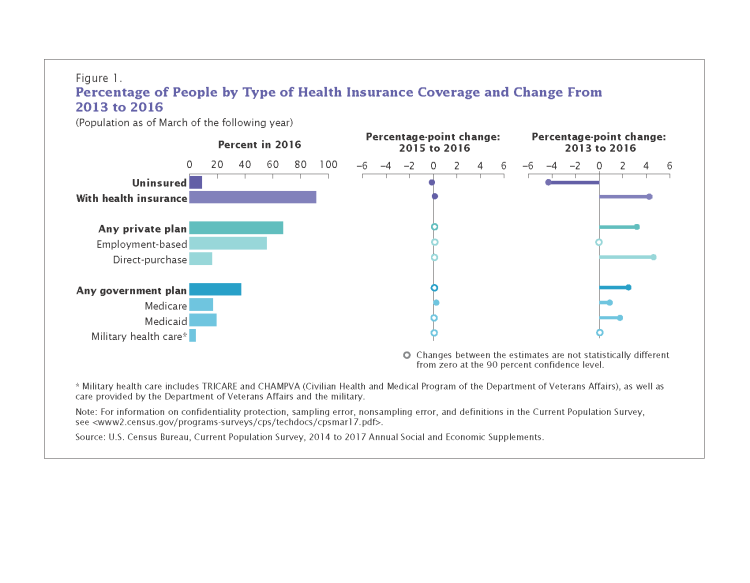
- The uninsured rate decreased between 2015 and 2016 by 0.3 percentage points as measured by the CPS ASEC. In 2016, the percentage of people without health insurance coverage for the entire calendar year was 8.8 percent, or 28.1 million, lower than the rate and number of uninsured in 2015 (9.1 percent or 29.0 million).
- The percentage of people with health insurance coverage for all or part of 2016 was 91.2 percent, higher than the rate in 2015 (90.9 percent).
- In 2016, private health insurance coverage continued to be more prevalent than government coverage, at 67.5 percent and 37.3 percent, respectively. Of the subtypes of health insurance coverage, employer-based insurance covered 55.7 percent of the population for some or all of the calendar year, followed by Medicaid (19.4 percent), Medicare (16.7 percent), direct-purchase (16.2 percent), and military coverage (4.6 percent).
- Between 2015 and 2016, the rate of Medicare coverage increased by 0.4 percentage points to cover 16.7 percent of people for part or all of 2016 (up from 16.3 percent in 2015). There was no statistically significant difference between 2015 and 2016 for any other subtype of health insurance.
- Between 2015 and 2016, the percentage of people without health insurance coverage dropped for most ages under 65, with generally larger decreases for working-age adults (aged 19 to 64).
- The percentage of uninsured children under age 19, 5.4 percent, did not significantly change between 2015 and 2016.
- In 2016, the uninsured rate for children under age 19 in poverty, 7.0 percent, was higher than the uninsured rate for children not in poverty, 5.0 percent.
- In 2016, non-Hispanic Whites had the lowest uninsured rate among race and Hispanic origin groups, at 6.3 percent. The uninsured rates for Blacks and Asians were higher than for non-Hispanic Whites, at 10.5 percent and 7.6 percent, respectively. Hispanics had the highest uninsured rate, at 16.0 percent.
- Between 2015 and 2016, the percentage of people without health insurance at any time during the year fell 0.4 percentage points for non-Hispanic Whites, down to 6.3 percent. There was no statistical change in the uninsured rate for Blacks, Asians, or Hispanics during this period.
- Between 2015 and 2016, the percentage of people without health insurance coverage at the time of interview decreased in 39 states. Eleven states and the District of Columbia did not have a statistically significant change in their uninsured rate.
Related Blogs
-
Random Samplings BlogHealth Insurance Coverage Measurement in Two SurveysThe U.S. Census Bureau is releasing two sources for health insurance statistics for the U.S.: the Annual Social & Economic Supplement to the Current Population Survey & the ACS.
-
Random Samplings BlogUnderlying Dynamics of Changes in Health Insurance CoverageAge matters when determining whether people have health insurance, as well as what kind they have.
-
Random Samplings BlogWho Are the Uninsured?In 2016, there were about 27.3 million people (8.6 percent of the population) who lacked health insurance coverage according to the latest American Community Survey data.
-
Research Matters BlogHealth Insurance Coverage of VeteransFinancing the health care of veterans is of particular concern to the American public given the unique medical needs many require as a result of illnesses and injuries incurred while serving in the military.
Visualizations

-
VisualizationPopulation without Health Insurance Coverage by State: 2008 to 2016View health insurance coverage by state using data from the American Community Survey.
-
VisualizationUninsured Rate by State: 2008-2016 Interactive Data MapView uninsured rates by state using data from the American Community Survey.
Tables

Health Insurance Detailed Tables
-
TableCurrent Population Survey Tables for Health Insurance CoverageThe Current Population Survey is a joint effort between the Bureau of Labor Statistics and the Census Bureau.
-
TableAmerican Community Survey Tables for Health Insurance CoverageThese tables present data on state-level health insurance coverage in the United States.
Source & Accuracy
CPS ASEC Research Files
Current Coverage
Press Release
Others in Series
Publication
Income and Poverty in the United States: 2016
This report presents data on income, earnings, income inequality & poverty in the United States based on information collected in the 2017 and earlier CPS ASEC.
Publication
Family Income Up 8 Percent Since 1955 (Advance data)
Number of families by family income and distribution of families and unrelated individuals by total money income, United States, urban and rural, 1952 to 1956.
Publication
The Supplemental Poverty Measure: 2016
This report describes research on the Supplemental Poverty Measure (SPM).
Related Information
Page Last Revised - August 22, 2022