An official website of the United States government
Here’s how you know
Official websites use .gov
A .gov website belongs to an official government organization in the United States.
Secure .gov websites use HTTPS
A lock (
) or https:// means you’ve safely connected to the .gov website. Share sensitive information only on official, secure websites.
-
//
- Census.gov /
- Newsroom /
- News Releases /
- Over One-Third of Counties had an Uninsured Rate Below 10 Percent
For Immediate Release: Tuesday, April 09, 2019
Over One-Third of Counties had an Uninsured Rate Below 10 Percent
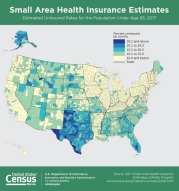
April 9, 2019 — In 2017, for the population under age 65, over one-third (38.4 percent) of all U.S. counties (3,141) had an estimated uninsured rate below 10 percent, a slight decrease from 2016 (38.6 percent). In 2013, the year before many provisions of the Patient Protection and Affordable Care Act (ACA) went into effect, only 130 counties (4.1 percent) had an uninsured rate of 10 percent or less.
From 2016 to 2017, over 91 percent of counties (2,879 counties) did not have a statistically significant change in their uninsured rate. Estimated county uninsured rates ranged from 2.3 percent to 33.7 percent, with a median county uninsured rate of 10.6 percent. Among counties that experienced a change in their uninsured rate, more saw an increase (183 counties) than a decrease (79 counties).
For working-age adults, age 18 to 64, living at or below 138 percent of poverty, county uninsured rates ranged from 5.7 percent to 60.3 percent. The median county uninsured rate was 22.7 percent. In states that expanded Medicaid eligibility, 9.3 percent of counties (139 of 1,498) had an estimated uninsured rate above 20 percent, compared with 81.9 percent of counties (1,346 of 1,643) in states that did not expand.
These findings come from the Small Area Health Insurance Estimates (SAHIE) program, which is the only source for single-year estimates of the number of people with and without health insurance coverage for each of the nation’s 3,141 counties. The county statistics of coverage status are provided by sex and age groups and at income levels that reflect thresholds for state and federal assistance programs. State estimates include health insurance coverage data by race and Hispanic origin in addition to age, sex and income thresholds.
Today’s release includes the 2017 SAHIE report that describes demographic and economic differences in health insurance status across states and counties, as well as trends in health insurance coverage. For more information on demographic differences in health insurance coverage, view the Uninsured Rates in Urban and Rural America visualization. An interactive data and mapping tool is also available. This tool allows users to create and download state and county custom tables, thematic maps and time-trend charts for all concepts available annually for 2006 through 2017.
No news release associated with this report. Tip Sheet only.
###
Share
Contact
Jewel Jordan
Public Information Office
301-763-3030
pio@census.gov
Related Information
 Yes
Yes
 No
NoComments or suggestions?


Top


