
Official websites use .gov
A .gov website belongs to an official government organization in the United States.
Secure .gov websites use HTTPS
A lock (
) or https:// means you’ve safely connected to the .gov website. Share sensitive information only on official, secure websites.

Topics
Data & Maps
Surveys & Programs
Resource Library

A Case Study of Census Business Builder
What’s the point of data if you can’t get to it easily any time you need it?
From household surveys like the American Community Survey to business programs like the Economic Census, the U.S. Census Bureau produces billions of estimates each year but helping everyone navigate all this data is also a core part of its mission.
The data are invaluable to a diverse mix of users, from grant writers applying for funding to improve their community to entrepreneurs who need trusted data about their markets to build business plans.
Many users said it was frustrating that data they need is often scattered across a dozen federal statistical agencies and other providers instead of located in one place.
But it’s not enough to just produce info. The Census Bureau must also make it easy to access by all types of users. So, it has developed and continues to develop data tools tailored to the needs of all users — no matter their online prowess.
How does it develop these data tools? What role do users play in creating them?
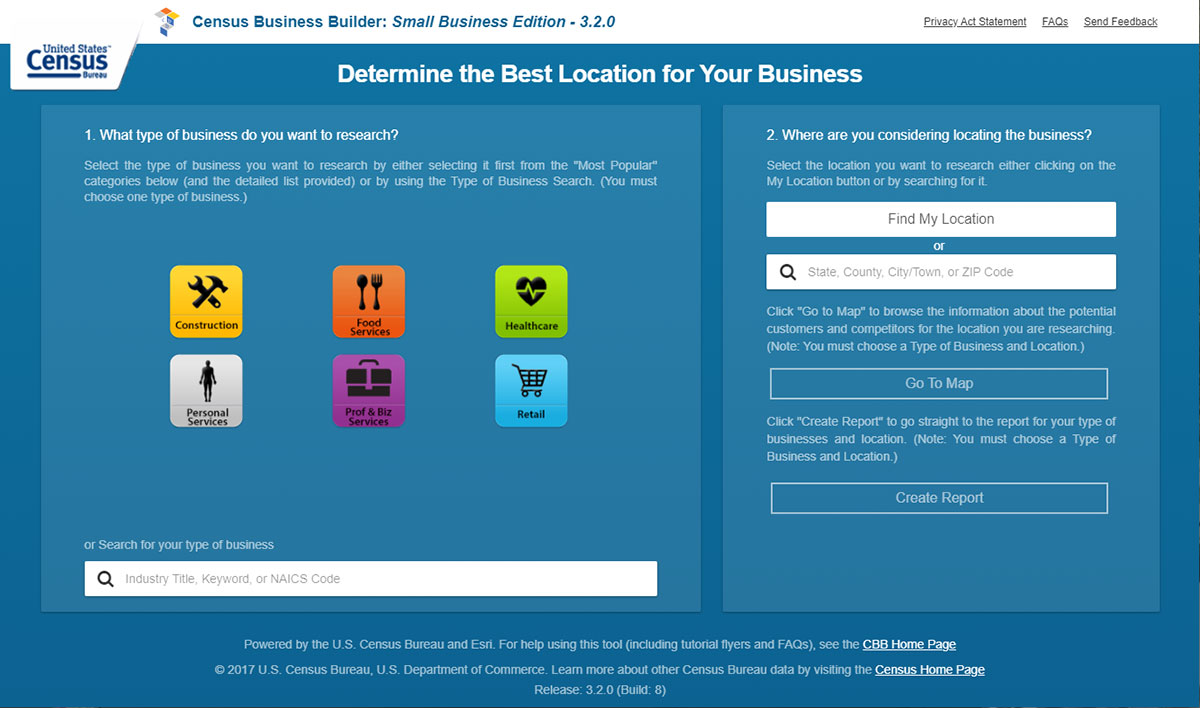
Take the Census Business Builder (CBB) for example.
First released in 2015, CBB was designed to make it easier for small business owners and entrepreneurs to access key data they need for their research. The tool provides interactive maps and downloadable reports users can easily incorporate into their research.
Two driving principles behind CBB are “agile development” and “customer focused.” These principles have not only guided the evolution of CBB but the development of other Census Bureau data tools, too.
Agile Development
In traditional software development, all features and functionality are identified during a long design and development cycle before the tool is released to the users, who only then provide feedback on whether it meets their expectations or falls short.
But CBB followed a different path. Using an agile development methodology, software was released faster, with new features added and modified more frequently. This allowed developers to try out new features and implement them in a more piecemeal fashion rather than wait until the feature is “perfect” on day one.
CBB is released quarterly and new features and functionality have been implemented gradually in multiple releases rather than all at once.
Customer Focused
From its inception, customer feedback has been critical in CBB’s creation. Applying this feedback via an agile development model has allowed users to play an integral role in nearly every aspect of CBB, from how the data are shown to the functionality of the tool.
The prototype release 0.1 of CBB, first presented at the annual America’s Small Business Development Centers conference in 2015, included just four data variables from the ACS. Version 3.3, released Jan. 25, includes over 90 variables from the ACS.
It also now includes more than 80 variables from six Census Bureau business programs: County Business Patterns, Nonemployer Statistics, the Economic Census, Quarterly Workforce Indicators, Building Permits, and International Trade.
These data were all added based on feedback from users who made a case for adding the data. If it’s important to our users, it’s important to us.

This feedback also guided the addition of data from sources outside the Census Bureau.
Many users said it was frustrating that data they need is often scattered across a dozen federal statistical agencies and other providers instead of located in one place.
To help address this, CBB 3.3 now includes agriculture statistics from the United States Department of Agriculture, National Agricultural Statistics Service (USDA-NASS), labor force data from Bureau of Labor Statistics Quarterly Census of Employment and Wages (BLS QCEW) and consumer spending data from Esri, the company that developed CBB for the Census Bureau.
User feedback also led to the addition of an “Upload” feature that enables users to upload their own data and overlay it with other data in the tool. This feature is unique to CBB at the Census Bureau.
Feedback Equals Functionality
Customer feedback has also shaped other CBB features and functionality.
In the initial releases, data were only shown at the state and county levels, but users told us they also needed city, ZIP Code, and Census Tract level data to help them make decisions. Today, the CBB includes those levels.

Users also told us it would be helpful for market research to have a feature that allows them to display only the areas on the map that meet their particular criteria. Today, a filter feature is included as the fourth option in the menu bar across the top of the map.
We also learned that users wanted the ability to return to where they were in CBB and to share their research and findings with others. To meet this need, a bookmarking feature was added to both the map and report allowing users to save the URL. When they click on it later, it takes them right back to the map or report.

Users told us, too, that they’d like to be able to view more than one data variable on the map at a time. So, we added a bi-variate mapping feature to version 3.3 to meet this need. This feature allows users to view any two of CBB’s more than 170 variables on the map. One variable is displayed in the color fill on the map and the other as a graduated circle.

Finally, user feedback led to a second edition of CBB. In 2016, users from the Association of Chamber of Commerce Executives told us that while they liked CBB: Small Business Edition, they would prefer a tool that let them look at all of the businesses in their service area and build a custom geography that represents the multi-county and/or city area they serve.
They talked and we listened. In 2016, the CBB: Regional Analyst Edition was released to address their need.

Your Feedback is Critical
The data needs of our users are ever-changing. That’s why sharing what they do and don’t like about our data programs and tools is more important now than ever.
To ensure your needs are met, please be generous with your feedback in the presentations, webinars, social media and other outreach tools we utilize. We also encourage using the various “feedback” buttons and links we provide in our tools. (The CBB feedback link is in the top right of the menu bar.)
Your comments shape not only what we do in CBB but also what we do with other data tools, including our new data.census.gov platform.
Thank you to everyone who has commented over the years.
Andrew W. Hait is an economist at the U.S. Census Bureau.
Stats for Stories
Small Business Saturday: November 25, 2023
In 2021, there were an estimated counted 8,148,606 U.S. small businesses. Most (7,037,001) had fewer than 20 employees and averaged about 4.3 each.
Stats for Stories
Minority Enterprise Development Week: October 22-28, 2023
According to the U.S. Census Bureau, there were 55.8M U.S. residents 65 years and older in the 2020 Census and 57.8M in the July 1, 2022, population estimates.
This article was filed under:
America Counts Story
What is a Small Business?
Newly released “Establishment and Firm Size” data from the 2017 Economic Census show how important small businesses are to the U.S. economy.
America Counts Story
Census Survey Shows Shift in Expectations from Spring to Winter
The Small Business Pulse Survey shows a majority of businesses face long-term challenges while others experienced little or no effect from the pandemic.
America Counts Story
Can Census Bureau Data Drive Business Growth and Job Creation?
Knowing who your customers and competitors are can make or break a business. Census Bureau data can help.
Page Last Revised - October 8, 2021
✕
Is this page helpful?
 Yes
Yes
 No
No
 Yes
Yes
 No
No✕
NO THANKS
255 characters maximum
 255 characters maximum reached
✕
Thank you for your feedback.
Comments or suggestions?

Comments or suggestions?