
Official websites use .gov
A .gov website belongs to an official government organization in the United States.
Secure .gov websites use HTTPS
A lock (
) or https:// means you’ve safely connected to the .gov website. Share sensitive information only on official, secure websites.

Topics
Data & Maps
Surveys & Programs
Resource Library
National Thrift Store Day: August 17, 2023
National Thrift Store Day: August 17, 2023
Press Release Number CB23-SFS.117
According to NARTS: The Association of Resale Professionals:
“There are currently more than 25,000 resale, consignment and Not For Profit resale shops in the United States.
“Resale is a multi-billion dollar a year industry. There is a major discrepancy on annual revenues reported for the U.S. resale industry.
“First Research estimates the used merchandise industry in the U.S. includes about 20,000 stores with combined annual revenue of about $15 billion. The secondhand and resale market is forecast to reach about $53 billion by 2023, according to the annual forecast from thredUP, an online resale marketplace. About $27 billion accounts for resale and $26 billion accounts for traditional secondhand (thrift and donation), according to a CNBC report. The global secondhand goods market is expected to grow by 24% in 2022, according to a new thredUP survey of 3,500 U.S. adult consumers and 50 fashion retailers conducted by GlobalData. The report estimates that the U.S. secondhand market will more than double by 2026, reaching $82 billion.
“Almost three-fourths of retail executives said they currently offer or are open to providing secondhand goods to their customers, an increase from 2020, the report said. Sixty-two percent of Gen Z and millennial consumers said they look for items secondhand before buying new. And almost half of Gen Z and millennial consumers (46%) consider the potential resale value of an item before purchasing it, per the report.
“Changes in consumer buying habits and an influx of new competitors and investor money are enlarging and reshaping the market for used apparel. Re-commerce companies, including The RealReal, Poshmark, and thredUP, are forecast to account for about 20% of the clothing industry by 2031, according to RetailDive.”

Key Stats
Source: 2021 County Business Patterns (CBP).

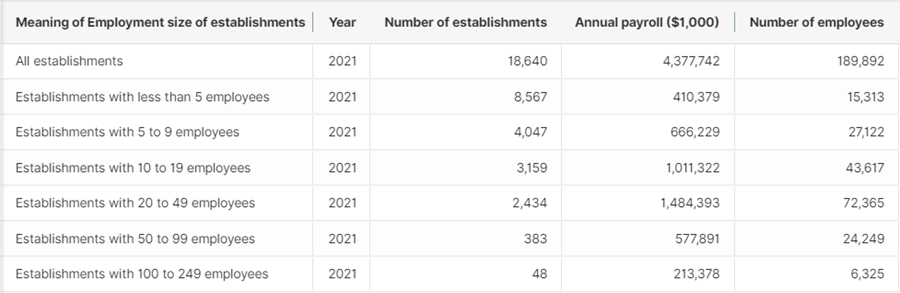
Note: The table above is cropped on the bottom and modified to hide some columns. Click on the image for the full table. Click on the “Hide” tab to show hidden columns.
More Stats
Source: Monthly Retail Trade Survey, 1992-2023.

Source: 2021 Annual Retail Trade Survey (ARTS).

Source: 2020 Annual Business Survey (ABS) Program
Source: 1978-2000 Business Dynamics Statistics (BDS)
Source: 2019 Nonemployer Statistics (NES)
Source: 2017 Economic Census.
Outside Links
Page Last Revised - November 2, 2023
✕
Is this page helpful?
 Yes
Yes
 No
No
 Yes
Yes
 No
No✕
NO THANKS
255 characters maximum
 255 characters maximum reached
✕
Thank you for your feedback.
Comments or suggestions?

Comments or suggestions?