Living Arrangements Varied Across Age Groups
Almost 1 in 10 young adults ages 18-34 and nearly 3 in 10 adults 65 or older lived alone in 2022, according to a new U.S. Census Bureau report.
Among 25- to 34-year-olds, a larger share of women (43%) than men (34%) lived with a spouse and about 17% of young adult men and women in that age group lived with an unmarried partner.
The report provides a demographic profile of the households and living arrangements of Americans and how they have changed over time by sex and across age groups.
The most common living arrangement among 18- to 24-year-olds in 2022 was living in a parent’s home (Figure 1).
More than half of adult men and women in that age group lived in a parental home. In this survey, young adults living in college dorms are counted as living in their parents’ home.
Among 25- to 34-year-olds, a larger share of women (43%) than men (34%) lived with a spouse and about 17% of young adult men and women in that age group lived with an unmarried partner.
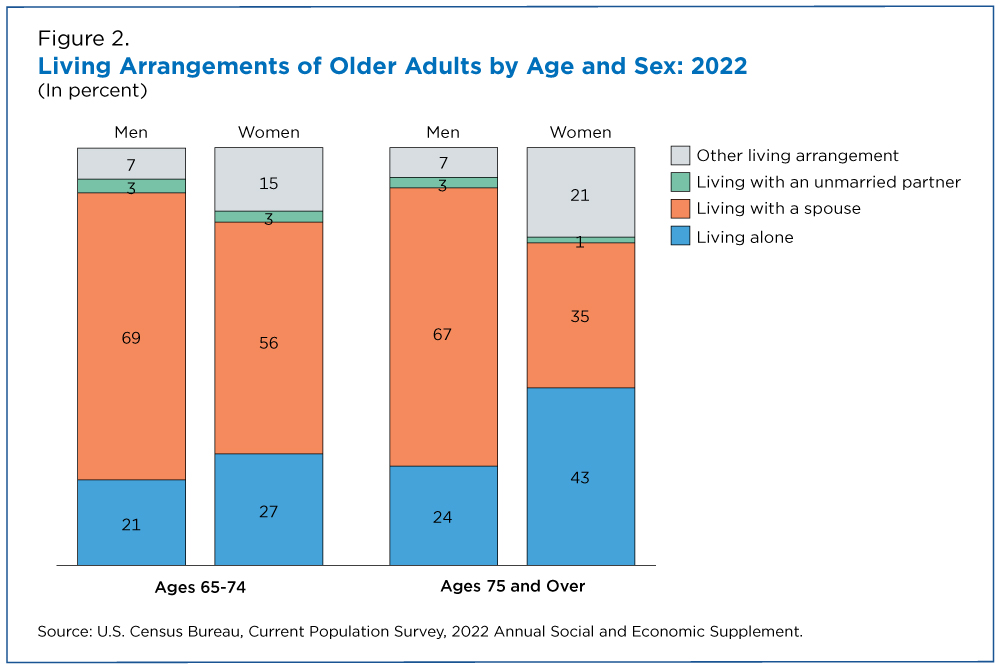
Among older adults, about 27% of women ages 65 to 74 and 43% of those age 75 or older lived alone (Figure 2).
In the age 75 and older group, men (67%) were nearly twice as likely as women (35%) to live with a spouse, a reflection of the longer life expectancy of women.
Living with Parents Then and Now
In 1960, 52% of 18- to 24-year-old men were living in their parents’ home, compared to 35% of women in that age range (Figure 3). By 2022, however, those percentages had increased to 57% and 55%, respectively.
The large increase in the share of women living with their parents is at least partially attributable to the increase in women enrolled in college and marrying later.
A lower percentage of men and women ages 25 to 34 lived in their parents’ home although, as was the case with younger adults, the rates grew from 1960 to 2022.
In 1960, just 11% of men and 7% of women in that age group lived with their parents. By 2022, 19% of men and 12% of women were living in their parents’ home.
Other highlights:
- About 47% of U.S. households in 2022 were married-couple households, down from 71% in 1970.
- In 2022, less than two-thirds of all family groups with children under age 18 were maintained by married parents.
- About 74% of mothers and 91% of fathers with a child in the household were also living with their child’s other parent in 2022.
- In 2018, about 17% of children lived in a household that received food stamps, compared to 20% in 2020.
- In 2022, 5% of married parents and 34% of unmarried parents with a child in the household lived in poverty during the previous year.
- From 2019 to 2021, the share of children with no coresident parent(s) in the labor force increased from about 7% to 8%.
Note
All comparative statements have undergone statistical testing and, unless otherwise noted, all comparisons are statistically significant at the 90% confidence level. All data are subject to error arising from a variety of sources, including sampling error, non-sampling error, modeling error, and any other sources of error.
More information on data collection, standards and accuracy is available in the technical documentation.
Related Statistics
-
Stats for StoriesUnmarried and Single Americans Week: September 17-23, 2023In 2022, about 132.3 million or 49.3% of Americans age 15 and over were unmarried, according to the Current Population Survey.
-
Stats for StoriesOlder Americans Month: May 2023The 2021 American Community Survey estimated there were 55,892,014 people aged 65 and over in the U.S. out of a total population of 331,893,745, or 16.8%.
-
Stats for StoriesNational Parents’ Day: July 23, 2023Of the 63.2M parents living with their children <18, 76.1% lived with a spouse, 15.1% had no spouse/partner present. The rest lived with a cohabiting partner.
Subscribe
Our email newsletter is sent out on the day we publish a story. Get an alert directly in your inbox to read, share and blog about our newest stories.
Contact our Public Information Office for media inquiries or interviews.
-
Families and Living ArrangementsWork and Lifestyle of Young Adults Changed During the PandemicSeptember 06, 2023New data visualization shows differences in young adults’ work and lifestyle patterns such as working from home from 2019 to 2021.
-
PopulationThere’s No Place Like (Close to) HomeJuly 25, 2022New research shows where people move as young adults. Eight in 10 live within 100 miles of where they grew up.
-
HousingYounger Householders Drove Rebound in U.S. HomeownershipJuly 25, 2023Housing Vacancy Survey found homeownership rates, especially among those age 44 and younger, improved in all regions.
-
IncomeHow Income Varies by Race and GeographyJanuary 29, 2026Median income of non-Hispanic White households declined in five states over the past 15 years: Alaska, Connecticut, Louisiana, Nevada, and New Mexico.
-
HousingRental Costs Up, Mortgages Stayed FlatJanuary 29, 2026Newly Released American Community Survey compares 2020-2024 and 2015-2019 housing costs by county.
-
HousingShare of Owner-Occupied, Mortgage-Free Homes Up in 2024January 29, 2026The share of U.S. homeowners without a mortgage was higher in 2024 than a decade earlier nationwide and in every state, though not all counties saw increases.
-
PopulationU.S. Population Growth Slowest Since COVID-19 PandemicJanuary 27, 2026The decline in international migration was felt across the states, though its impact varied.


