New Data Visualization Shows More Young Adults Worked From Home and Lived Alone During the COVID-19 Pandemic
Young adulthood (ages 18-34) is characterized by many life changes that may include starting employment, going to college and new living situations. But in recent years, this life stage has been affected by the COVID-19 pandemic, which has brought about large-scale societal transformations.
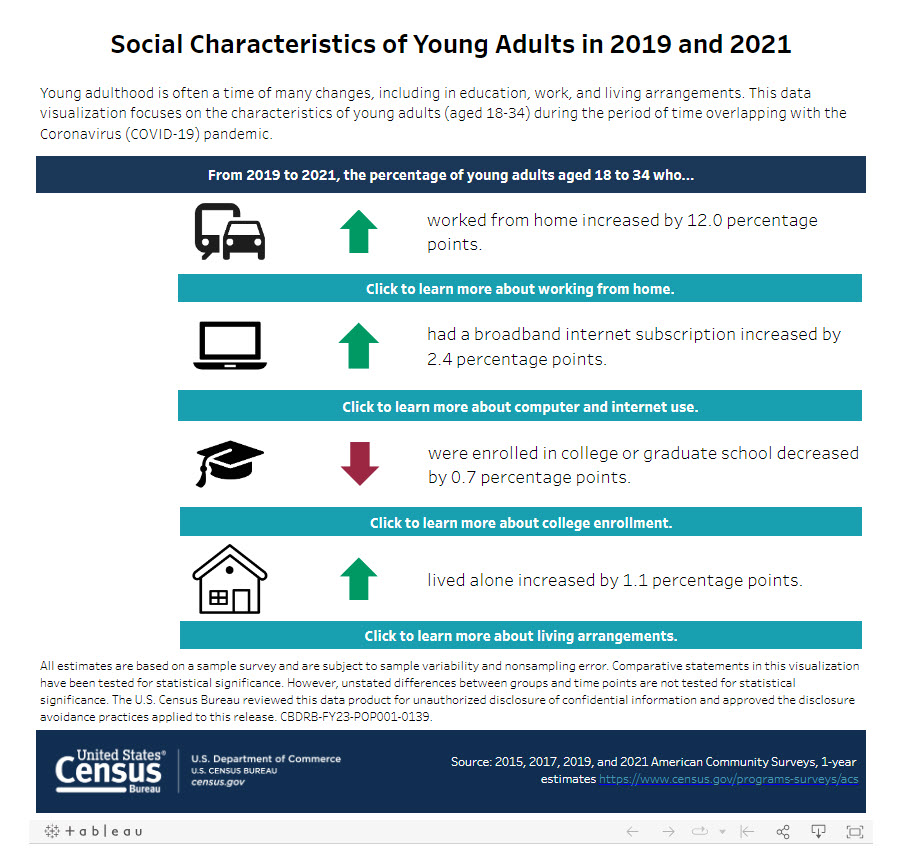
A new U.S. Census Bureau data visualization explores these changes across a myriad of social characteristics of young adults from 2019 to 2021 including working from home; college enrollment; living arrangements; and computer and internet use.
Between 2019 and 2021, the share of young adults ages 18 to 34 who:
- worked from home increased by 12.0 percentage points.
- had a broadband internet subscription increased by 2.4 percentage points.
- were enrolled in college or graduate school decreased by 0.7 percentage points.
- lived alone increased by 1.1 percentage points.
Other highlights of changes in the social characteristics of young adults from 2019 to 2021:
- The percentage of young adults working from home in Massachusetts increased 19.5 points from 4.8% to 24.3%.
- The percentage of young adults who owned a laptop or desktop computer in Mississippi increased 5.2 points from 72.1% to 77.3%.
- The number of young adults enrolled in public undergraduate educational institutions decreased 12.9%, from roughly 12.6 million in 2015 to 10.9 million in 2021.
Note: Select the image to go to the interactive data visualization.
All data come from the American Community Survey (ACS) 1-year estimates.
The landing page of the visualization displays general statistics for each of the pages in the visualization: working from home; computer and internet use; college enrollment; and living arrangements.
All four pages have a dynamic graph that lets you explore each topic by a variety of characteristics as well as the percentage point change from 2019 to 2021.
Drop-down menus allow you to change the characteristics and age groups. Other highlights include maps of the percentage of young adults working from home and computer ownership by state; dynamic graphs showing recent trends in public and private college enrollment; and rich data on living arrangements.
Related Statistics
-
Stats for StoriesSingles Awareness Day: February 15, 2024The 2022 Annual Social and Economic Supplement estimated there were 132.3M unmarried (never married, divorced and widowed) people in the U.S. ages 15 and older.
-
Stats for StoriesUnmarried and Single Americans Week: September 17-23, 2023In 2022, about 132.3 million or 49.3% of Americans age 15 and over were unmarried, according to the Current Population Survey.
-
American Community Survey (ACS)The American Community Survey is the premier source for information about America's changing population, housing and workforce.
Subscribe
Our email newsletter is sent out on the day we publish a story. Get an alert directly in your inbox to read, share and blog about our newest stories.
Contact our Public Information Office for media inquiries or interviews.
-
PopulationFewer Younger Adults Drives Population Loss in Some U.S. CitiesJune 30, 2022Why did some cities lose population in 2021? Population estimates by characteristics released today provide some answers.
-
Income and PovertyMore Young Adults Lived with Their Parents in 2019September 15, 2020Poverty rates of people ages 25 to 34 living with their parents remained stable at 5.3%, lower than the U.S. poverty rate of 10.5%.
-
Families and Living ArrangementsYoung Adults Most Likely to Change Living ArrangementsAugust 31, 2020Newly released U.S. Census Bureau survey data highlight transitions in living arrangements by age and nativity.
-
IncomeHow Income Varies by Race and GeographyJanuary 29, 2026Median income of non-Hispanic White households declined in five states over the past 15 years: Alaska, Connecticut, Louisiana, Nevada, and New Mexico.
-
HousingRental Costs Up, Mortgages Stayed FlatJanuary 29, 2026Newly Released American Community Survey compares 2020-2024 and 2015-2019 housing costs by county.
-
HousingShare of Owner-Occupied, Mortgage-Free Homes Up in 2024January 29, 2026The share of U.S. homeowners without a mortgage was higher in 2024 than a decade earlier nationwide and in every state, though not all counties saw increases.
-
PopulationU.S. Population Growth Slowest Since COVID-19 PandemicJanuary 27, 2026The decline in international migration was felt across the states, though its impact varied.


