
Official websites use .gov
A .gov website belongs to an official government organization in the United States.
Secure .gov websites use HTTPS
A lock (
) or https:// means you’ve safely connected to the .gov website. Share sensitive information only on official, secure websites.

Topics
Data & Maps
Surveys & Programs
Resource Library

Around Four-Fifths of All U.S. Metro Areas Grew Between 2010 and 2020
Over the last decade, the nation grew at its slowest rate since the 1930s, a slowdown broadly reflected in local area 2020 Census population counts released today.
Less than half of the nation’s 3,143 counties or equivalents gained population from 2010 to 2020, while the populations of around four-fifths of metro areas grew during the time period.
In 2020, 86% of the U.S. population lived in metropolitan statistical areas, up from 85% in 2010. Another 8% lived in micropolitan statistical areas, down from 9% in 2010.
Among the decade’s most notable fast-growing areas were counties in western North Dakota, led by McKenzie County which grew by 131%, and Williams County, up 83%.
In 2020, 86% of the U.S. population lived in metropolitan statistical areas, up from 85% in 2010. Another 8% lived in micropolitan statistical areas, down from 9% in 2010.
Between 2010 and 2020, the population of U.S. metro areas grew by 9%, while the population of U.S. micro areas grew by 1%. All metro and micro areas in Puerto Rico lost population during that period.
The nation’s 10 largest incorporated places (cities) all grew this past decade.
Data Visualization
County Population Change
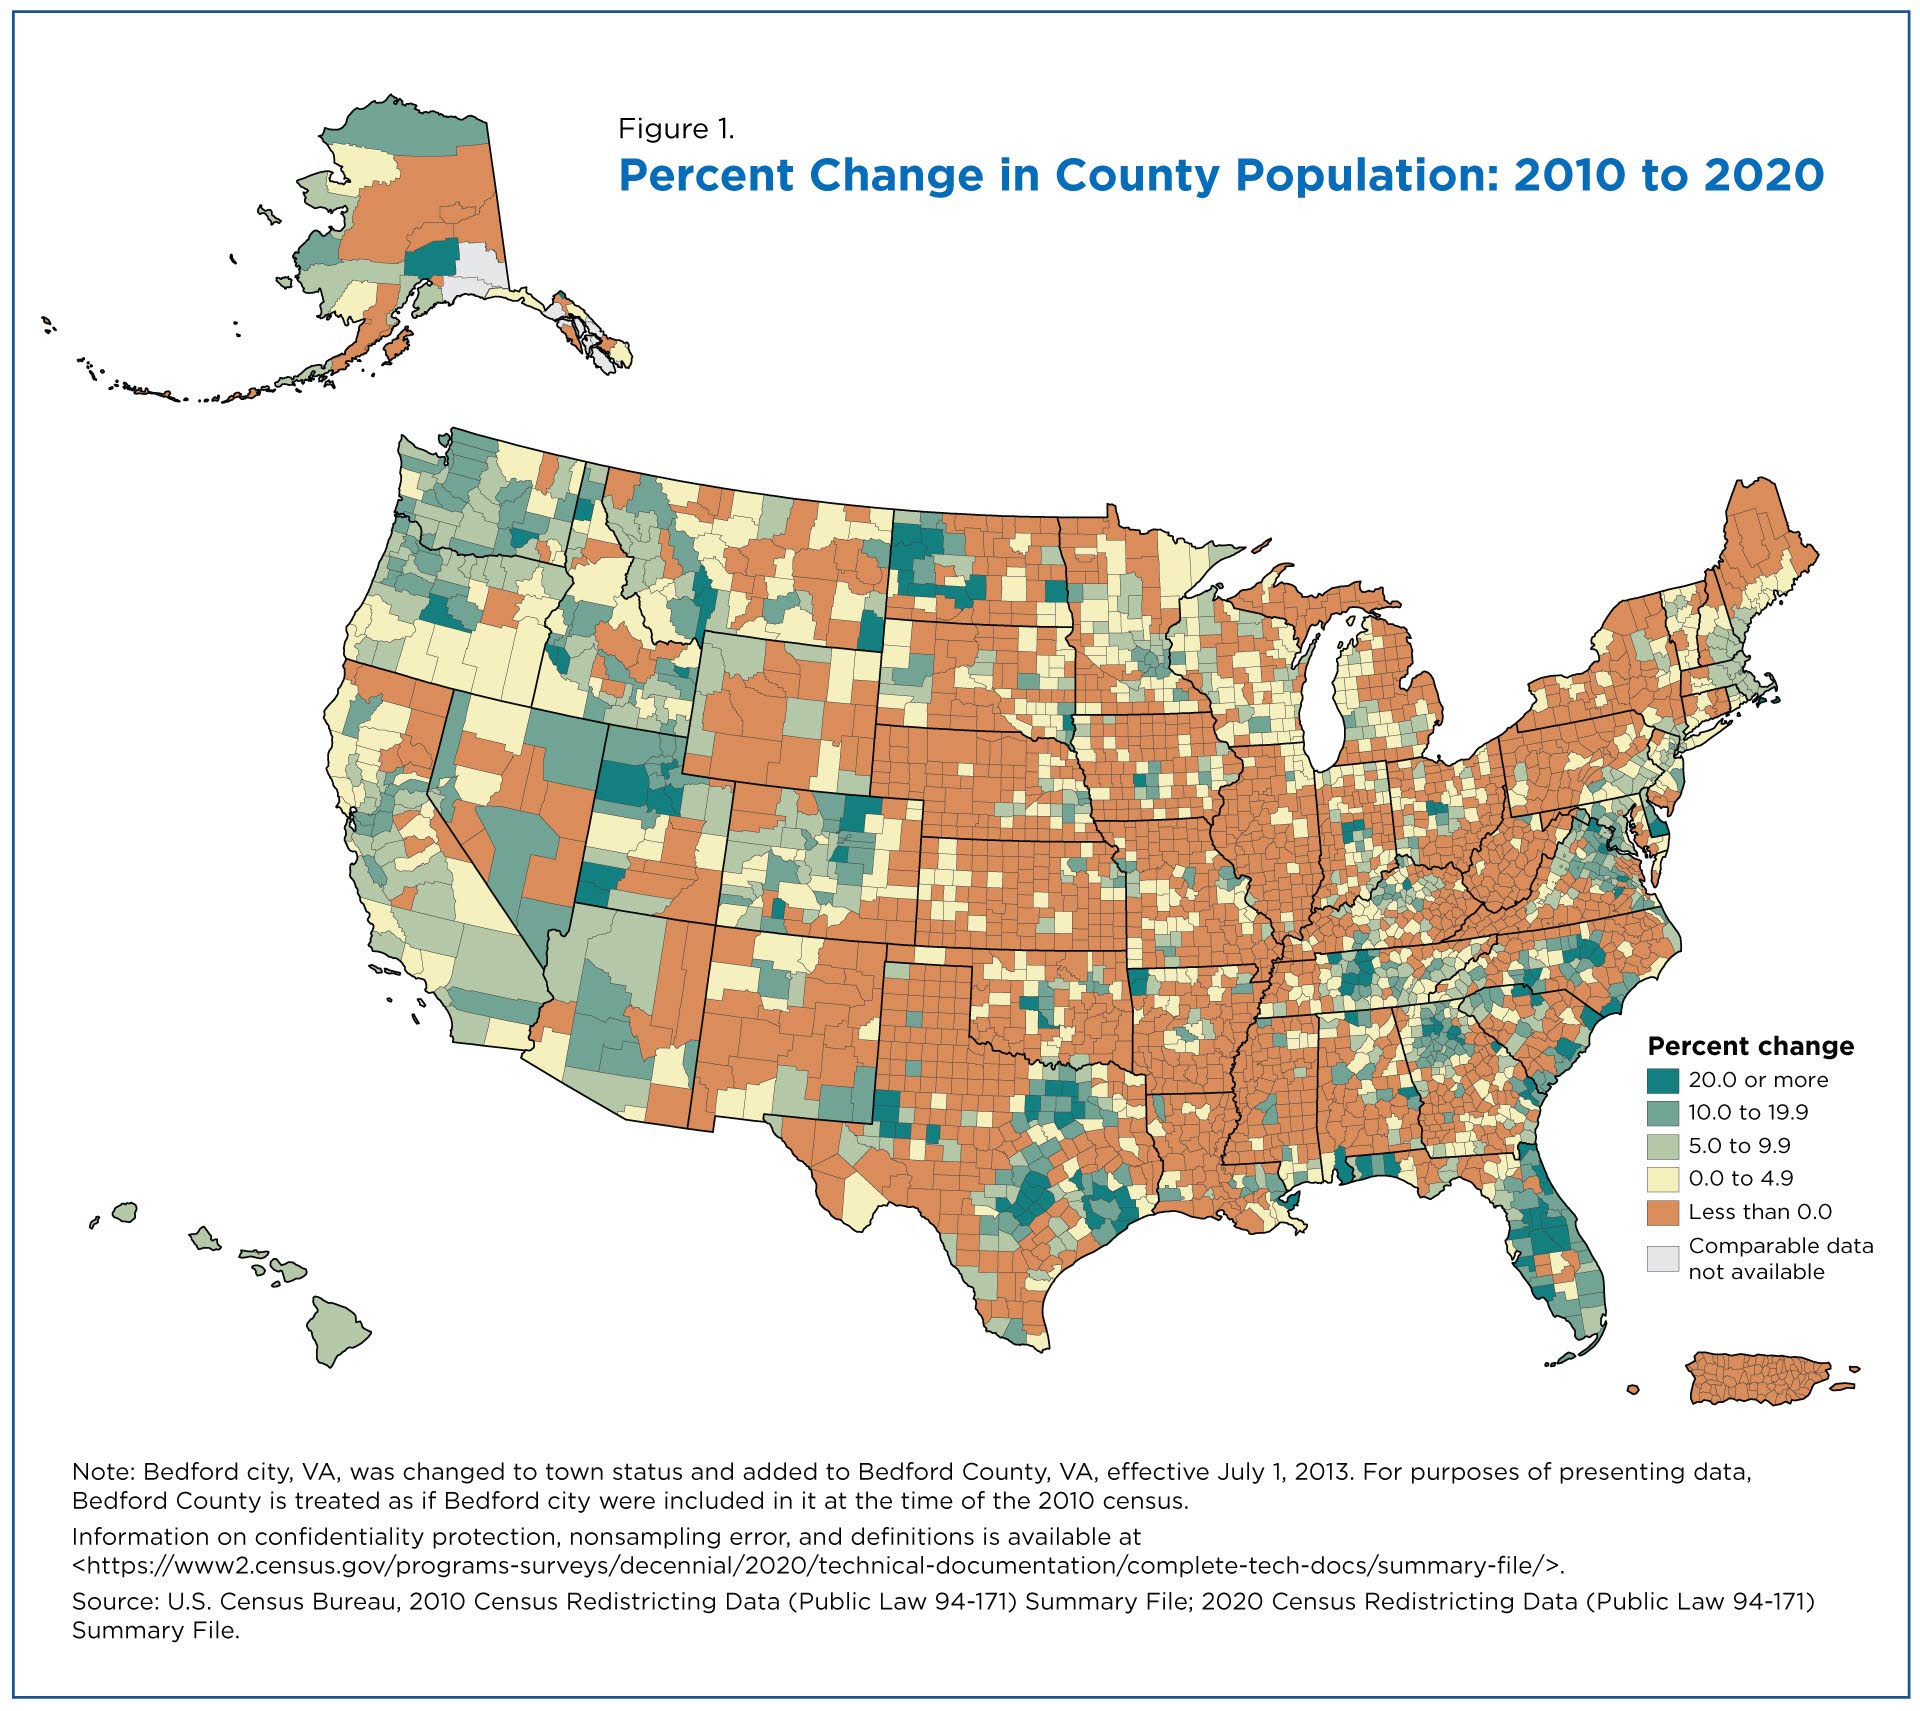
Almost half (47%) of U.S. counties or equivalents gained population between 2010 and 2020 (Figure 1).
Five counties (metro areas in parentheses) gained at least 300,000 people during that period: Harris County, Texas (Houston-The Woodlands-Sugar Land); Maricopa County, Arizona (Phoenix-Mesa-Chandler); King County, Washington (Seattle-Tacoma-Bellevue); Clark County, Nevada (Las Vegas-Henderson-Paradise); and Tarrant County, Texas (Dallas-Fort Worth-Arlington).
California’s Los Angeles County remained the largest county in 2020, crossing the 10.0 million-person mark between 2010 and 2020.
Population Change in Metro and Micro Areas
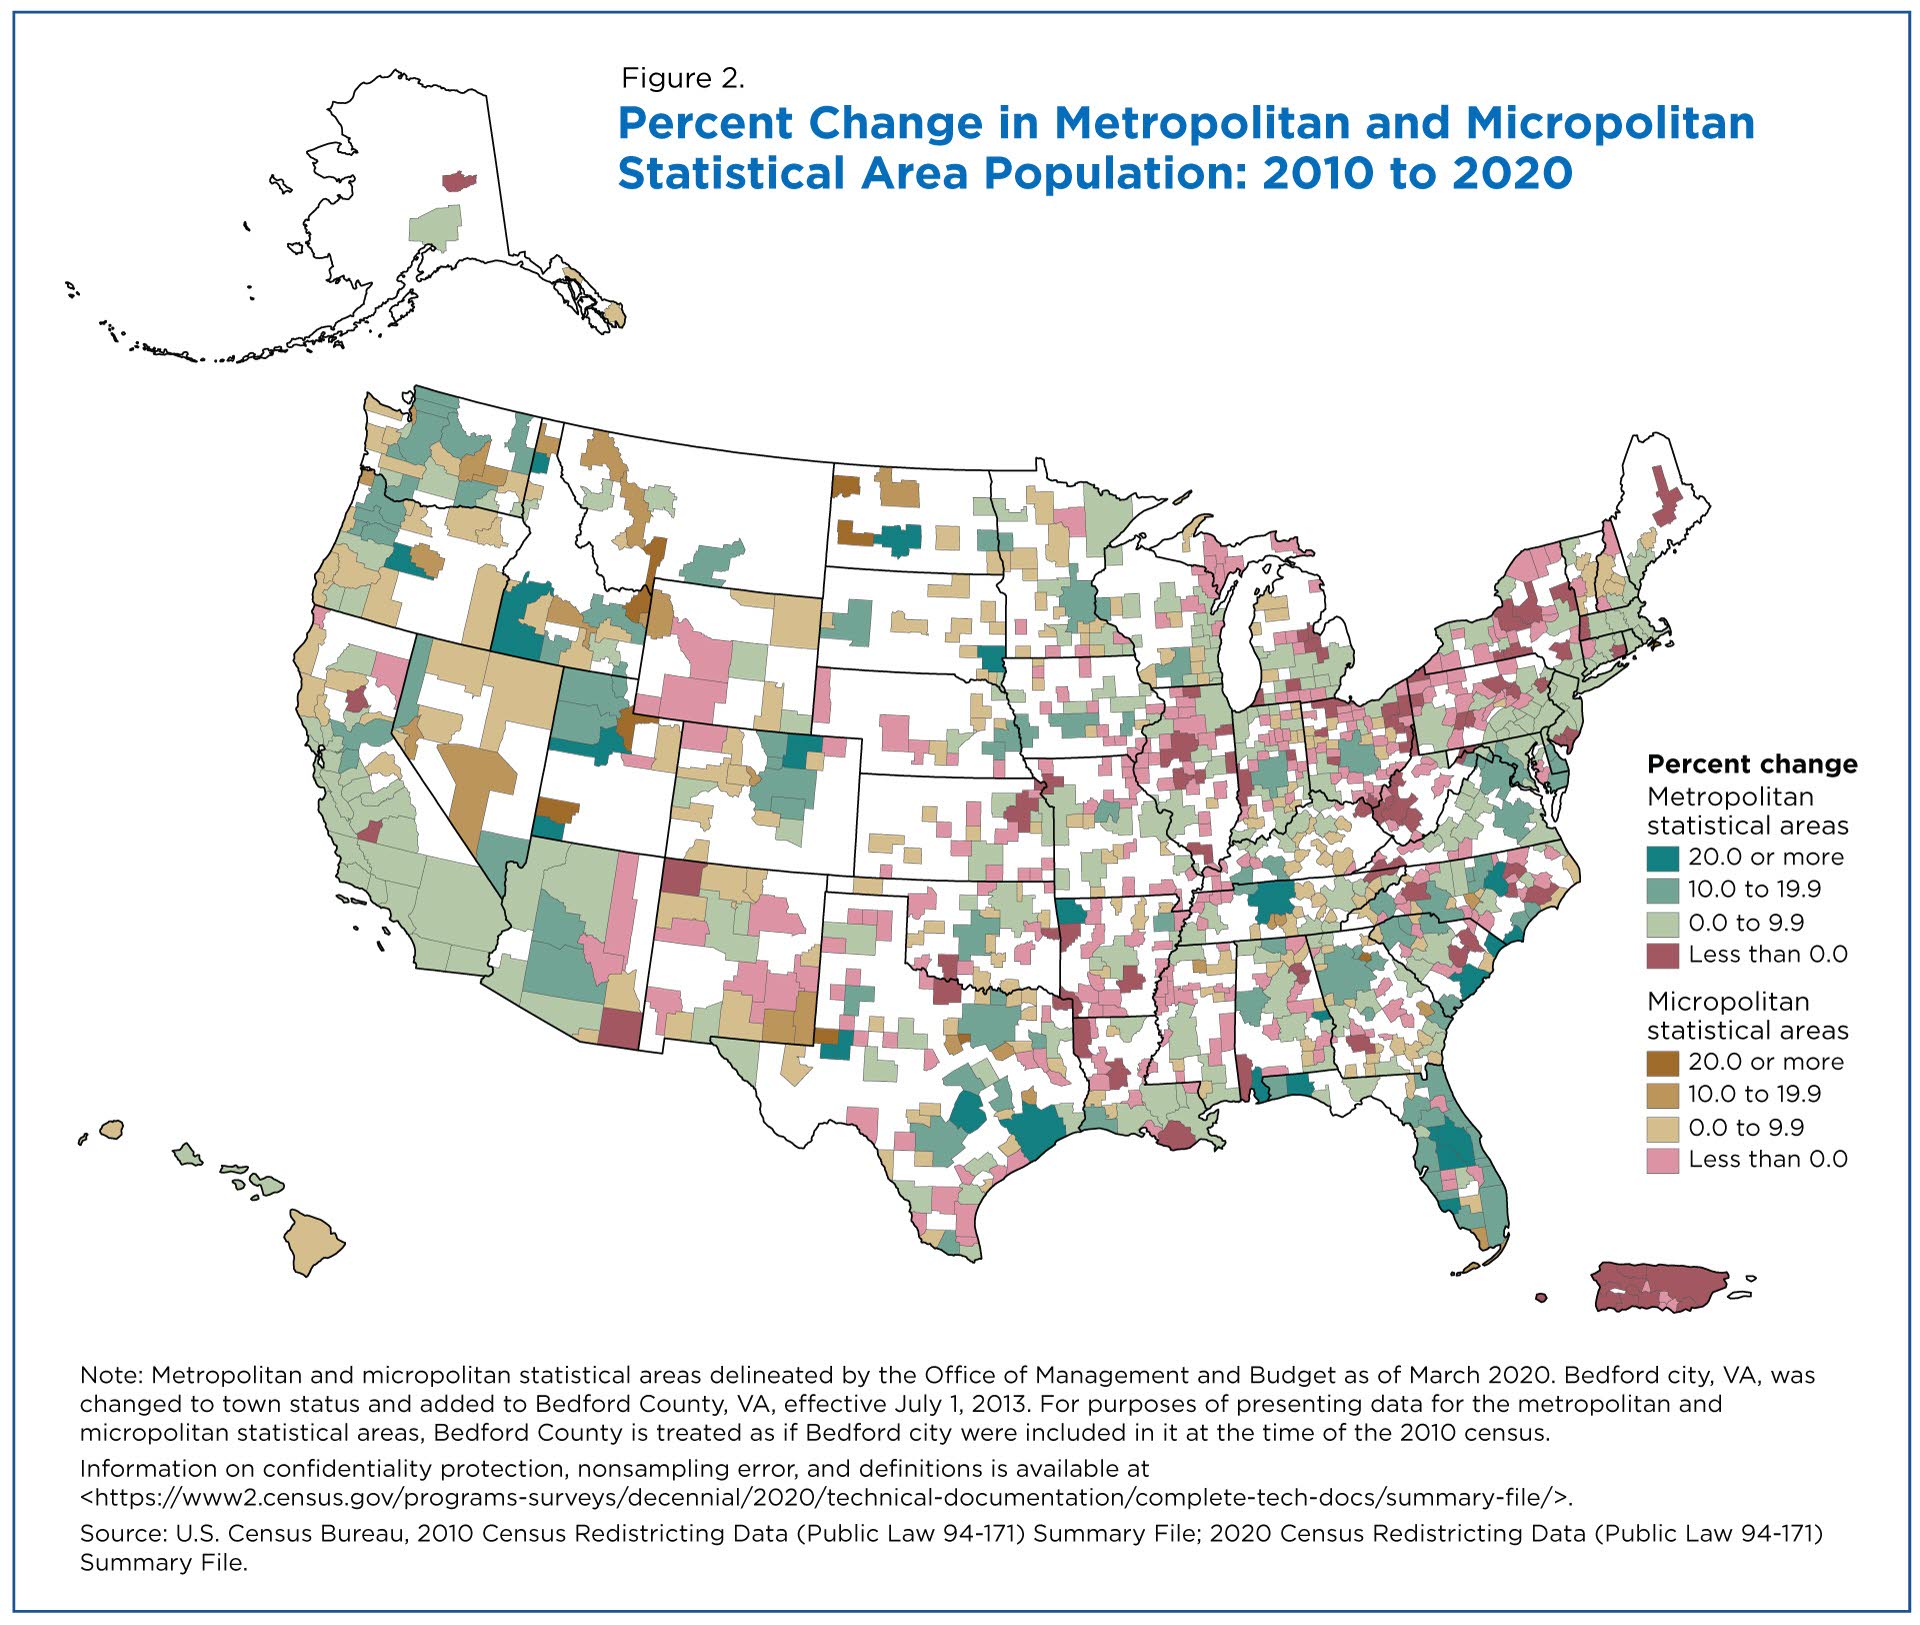
The population of around four-fifths (81%) of U.S. metro areas increased between 2010 and 2020 (Figure 2) but only 48% of U.S. micro areas grew over the decade.
The 10 largest metro areas all grew between 2010 and 2020, led by two in Texas: Dallas-Fort Worth-Arlington and Houston-The Woodlands-Sugar Land each grew by approximately 20%.
Dallas-Fort Worth and Houston were also two of the nation’s three metro areas to gain at least 1.2 million people over the decade. New York-Newark-Jersey City, NY-NJ-PA was the third.
Five metro areas crossed the 1.0 million-person threshold between 2010 and 2020: Grand Rapids-Kentwood, MI; Tucson, AZ; Urban Honolulu, HI; Tulsa, OK; and Fresno, CA.
Among all U.S. metro areas, The Villages in Florida grew the fastest, followed by Austin-Round Rock-Georgetown, TX; St. George, UT; Greeley, CO; and Myrtle Beach-Conway-North Myrtle Beach, SC-NC.
The two fastest-growing U.S. micro areas were in North Dakota (Williston and Dickinson), followed by one each in Montana (Bozeman), Idaho (Rexburg) and Utah (Heber).
Williston, Bozeman, Rexburg and Heber were also four of the six micro areas to gain at least 15,000 people between 2010 and 2020; the other two were Hilo, HI, and Jefferson, GA.
The faster-growing micro areas tended to be located near the faster-growing metro areas, while slower-growing and declining micro areas tended to be located near slower-growing and declining metro areas.
All metro and micro areas in Puerto Rico lost population between 2010 and 2020.
Population Change in Cities
All 10 of the largest incorporated places (cities) grew in the past decade (Table 1).
Four of the 10 largest incorporated places had 2020 populations of 2.0 million or more: New York, Los Angeles, Chicago and Houston. All of the 10 largest incorporated places had 2020 populations of 1.0 million or more, including 10th ranked San Jose, California, which crossed the 1.0 million person threshold between 2010 and 2020.

State Population Change
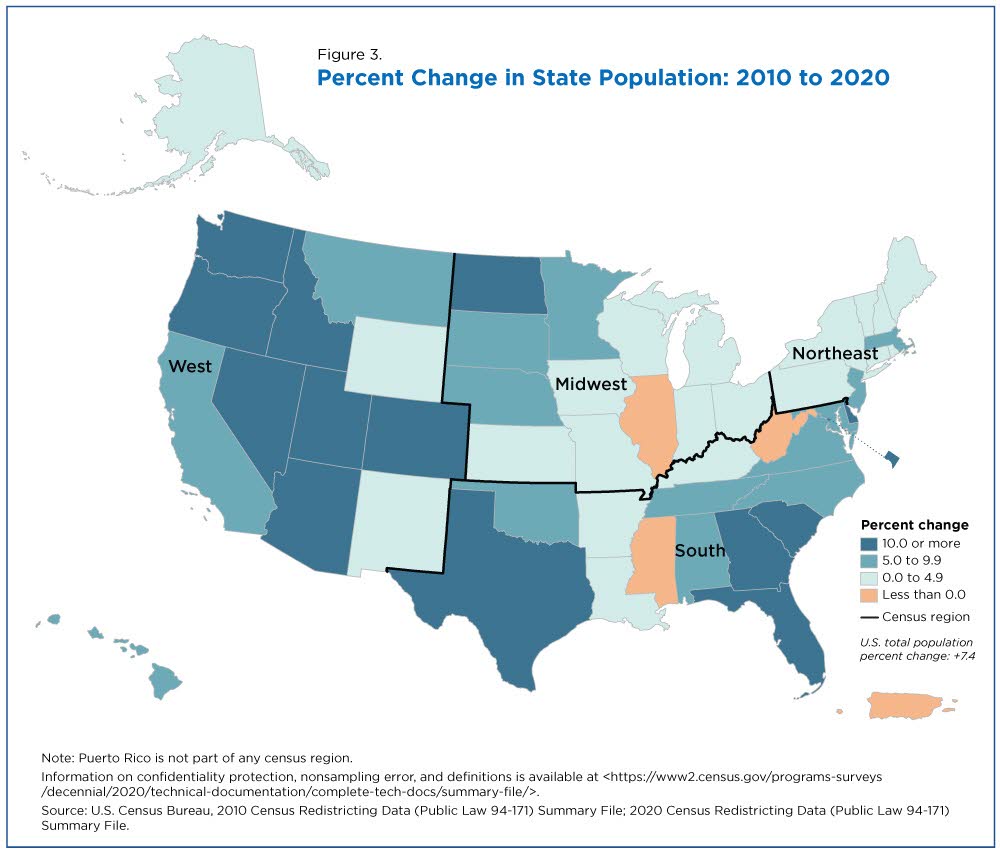
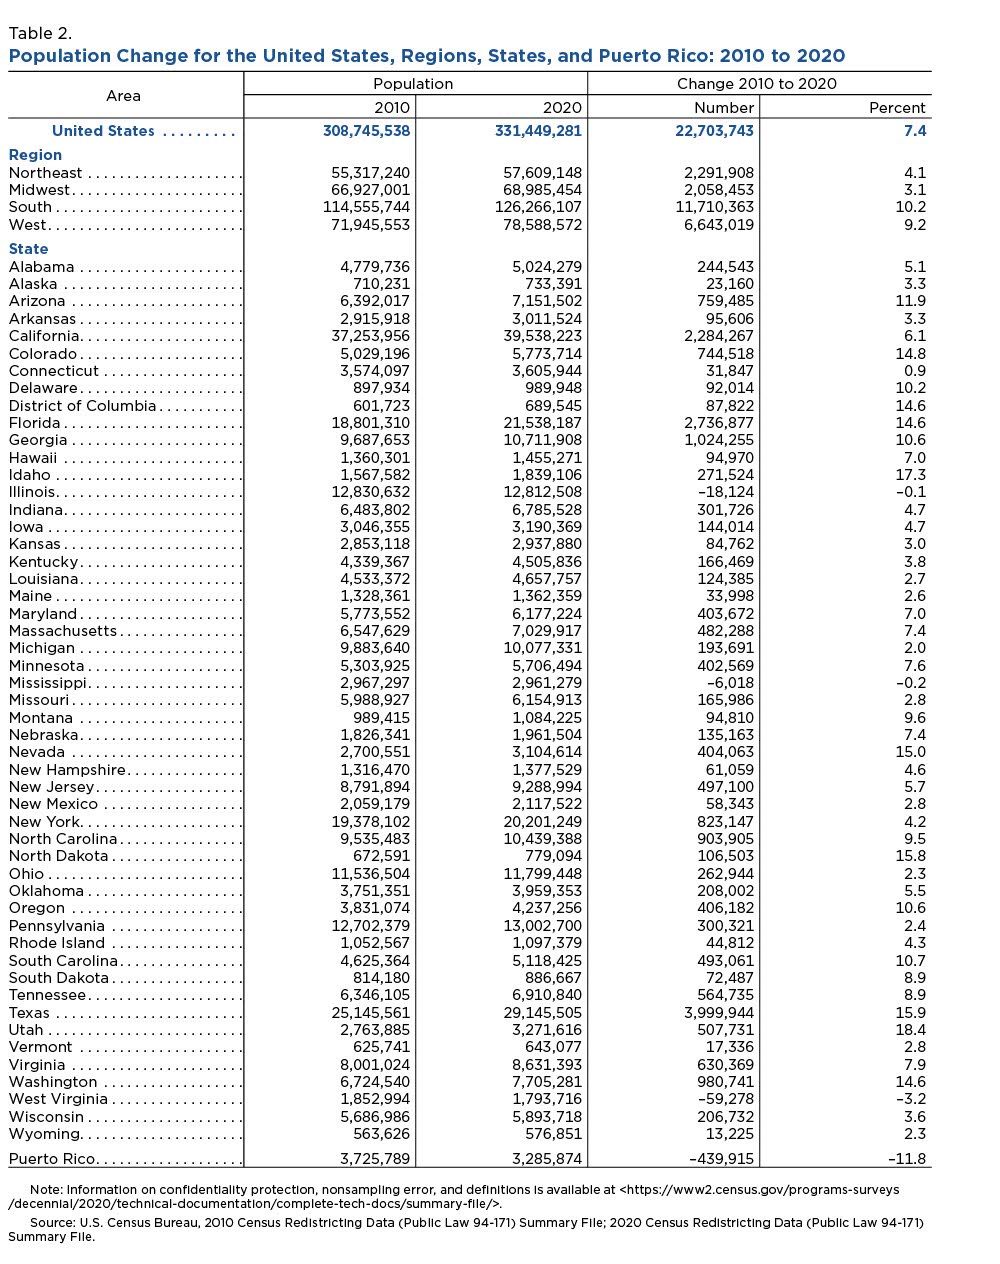
As first reported in April (when the 2020 Census apportionment numbers were released), Texas experienced the largest numeric increase between 2010 and 2020, followed by Florida, California, Georgia and Washington (Figure 3, Table 2).
These five states accounted for nearly half of the total numeric population increase in the United States between 2010 and 2020.
Utah was the fastest-growing state, increasing by 18.4% between 2010 and 2020, followed by Idaho, Texas, North Dakota and Nevada, which each grew by 15.0% or more.
Overall, 13 states and the District of Columbia grew by 10.0% or greater. All are in the West or South regions, with the exception of North Dakota in the Midwest region. Massachusetts was the fastest-growing state in the Northeast at 7.4%.
California was the most populous state in 2020 (39.5 million), followed by Texas (29.1 million), Florida (21.5 million), New York (20.2 million) and Pennsylvania (13.0 million).
Overall, 10 states had 2020 populations of 10.0 million or greater, which together contain more than half of the U.S. population.
The populations of three states — West Virginia, Mississippi and Illinois — and Puerto Rico declined over the decade.
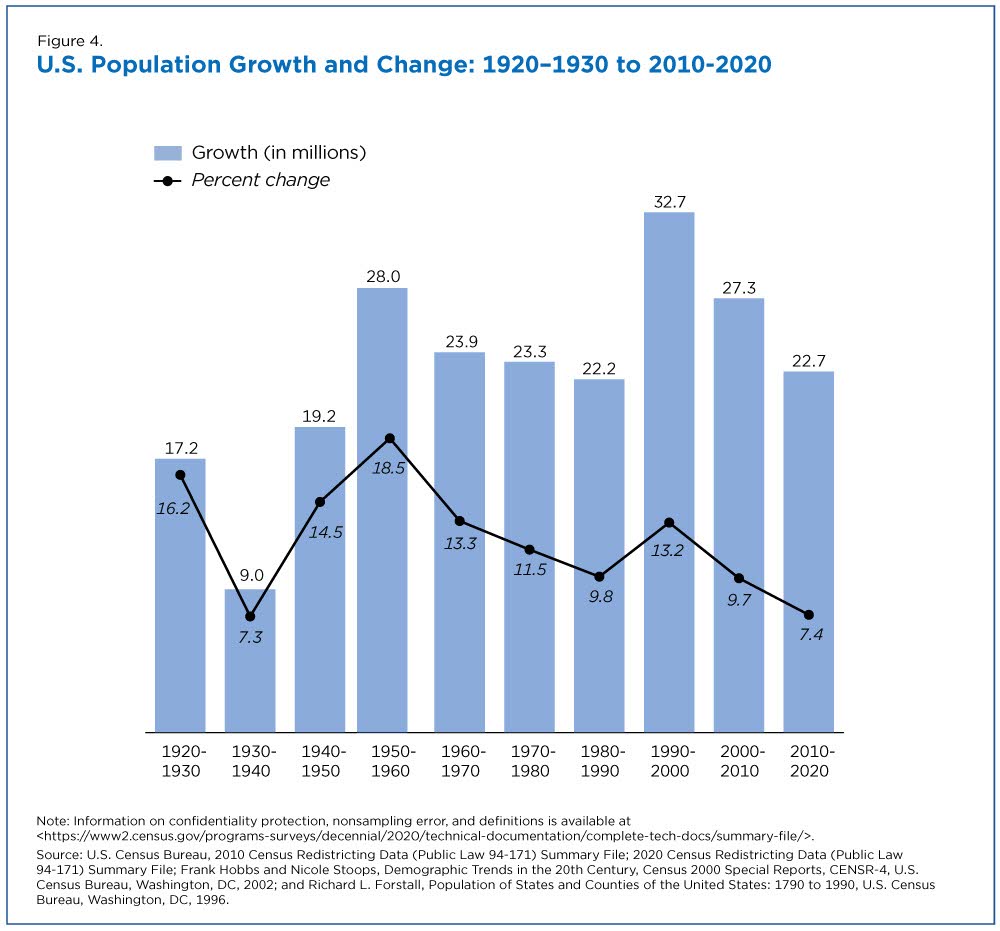
National Population Change
The total population of the United States on April 1, 2020, was 331.4 million, an increase of 22.7 million from 2010.
Last decade’s 7.4% increase was lower than the previous decade’s 9.7% increase and was, in fact, the lowest since the 1930s (Figure 4).
Paul Mackun is a geographer in the Census Bureau’s Population Division.
Joshua Comenetz is assistant chief of the Population Geography Staff in the Population Division.
Lindsay Spell is a geographer in the Population Division.
Redistricting Data (Public Law 94-171) Summary File News Conference
Surveys/Programs > Decennial
The U.S. Census Bureau provides the 50 states, the District of Columbia, and Puerto Rico with population counts to use in their redrawing of congressional and state legislative district boundaries — a process known as “redistricting.”
While the states are responsible for legislative redistricting, the Census Bureau provides population counts possible for the geographic areas the states need.
Redistricting & Voting Rights Data Office (RDO)
Redistricting Data Program
Public Law 94-171 requires the Census to provide state legislatures with the small area census population tabulations necessary for legislative redistricting.
2020 Census Redistricting Data Product Frequently Asked Questions
Information on plans to release the 2020 Census P.L. 94-171 Redistricting Data Summary Files.
Developing the DAS: Demonstration Data and Progress Metrics
The Census Bureau is building and evaluating the new cryptography-based disclosure avoidance system (“2020 DAS”) through a series of development “sprints.”
Visualizations
Visualization
2020 Population and Housing State Data
Visualization
The U.S. Adult and Under-Age-18 Populations: 2020 Census
View the percentage of the population that was aged 18 and over in 2020 for your state.
Visualization
2020 Census Demographic Data Map Viewer
The 2020 Census Demographic Data Map Viewer is web map application that includes state, county, and tract-level data from the 2020 Census.
Visualization
Racial and Ethnic Diversity in the U.S.: 2010 Census and 2020 Census
We use the Diversity Index (DI) to measure the probability that two people chosen at random will be from different race and ethnicity groups.
Visualization
Measurement of Race and Ethnicity Across the Decades: 1790–2020
This interactive timeline captures the race and ethnicity categories used in the U.S. decennial census in every decade from 1790 to 2020.
Visualization
Race and Ethnicity in the United States: 2010 Census and 2020 Census
View how race and ethnicity have changed by state from the 2010 Census and 2020 Census.
Data
Census Data Explorer (data.census.gov)
This is the first 2020 Census data release available on the Census Bureau’s data dissemination platform, data.census.gov. The site allows data users to search geographies down to the block level and access data through tables, maps and downloads.
Decennial Census P.L. 94-171 Redistricting Data Summary Files
Includes the official data, documentation, and support materials to assist in accessing P.L. 94-171 Redistricting Data.
Redistricting Data Datasets
Data files, for public use, with all personally identifiable information removed to ensure confidentiality. Users analyze, extract, customize and publish stats.
Tables
Summary Tables for FTP Download
The U.S. Census Bureau is providing redistricting data as legacy format summary files for all states on August 12, 2021.
Table
2020 Census Redistricting: Supplementary Tables
These tables present aggregated data on race and Hispanic origin from the 2020 Census Redistricting Data (P.L. 94-171)
Privacy Protected Microdata Detail File
The microdata included in the PPMFs do not include any actual census responses. They are simply the the microdata format, generated by 2 the DAS, and used by the Census Bureau’s tabulation production system to produce privacy protected tables.
Fact Sheets
Fact Sheet
Redistricting Data 101
The Census Bureau provides states, D.C., and Puerto Rico with population counts needed to redraw their legislative boundaries.
Fact Sheet
Protecting the Confidentiality of 2020 Census Redistricting Data
By law, we must ensure that we don’t release information that could identify your information in the statistics we publish.
Fact Sheet
Which Data Set Is Right for Me?
Key differences between the Decennial Census, Population Estimates Program and the American Community Survey.
Fact Sheet
Comparing Differential Privacy With Older Disclosure Avoidance Methods
Differential privacy, first developed in 2006, is a framework for measuring the precise disclosure risk associated with each release of confidential data.
Fact Sheet
What Are Synthetic Data?
This fact sheet describes synthetic data and how the U.S. Census Bureau is researching it's use in various projects.
Fact Sheet
Differential Privacy and the 2020 Census
Differential privacy is a mathematical approach inspired by modern cryptography principles that disguises an individual’s identity in published data.
Blog Posts
Random Samplings Blog
The Census Geocoder - Group Quarters Assistance
People living in group quarters, such as nursing homes, military barracks, and college/university student housing, are among the unique populations counted in the 2020 Census.
Random Samplings Blog
Improvements to the 2020 Census Race and Hispanic Origin Question Designs, Data Processing, and Coding Procedures
This blog discusses how we improved the census questions on race and Hispanic origin, also known as ethnicity, between 2010 and 2020.
Random Samplings Blog
How We Complete the Census When Demographic and Housing Characteristics Are Missing
Although we strive to obtain all demographic and housing data from every individual in the census, missing data are part of every census process.
Newsroom
Press Release
Local Population Changes and Nation’s Racial and Ethnic Diversity
The U.S. Census Bureau today released additional 2020 Census results showing an increase in the population of U.S. metro areas compared to a decade ago.
Press Release
El Censo resalta cambios locales, diversidad racial y étnica del país
La Oficina del Censo de los EE. UU. entrega los datos para que los estados comiencen las actividades de redistribución legislativa.
Press Kit
2020 Census Redistricting Data Files Press Kit
States may use these data on race, Hispanic origin, and the voting-age population to redraw electoral district boundaries.
Social Media Toolkit: Redistricting Data
Help us spread the word about the latest 2020 Census results!
Census Academy
2020 Census Resources
Tutorial
How to Visualize 2020 Census Redistricting Data for Your Area
In this Data Gem, you will learn how to use the 2020 Census Demographic Data Map Viewer to easily visualize 2020 Redistricting Data for your area.
Courses
How to Access 2020 Census Redistricting Data Files from the FTP Site
This all-levels course will teach you how access redistricting data.
Videos
Presentation
2020 Census Redistricting Data Release - Playlist
A collection of 2020 Census Redistricting videos produced by the U.S. Census Bureau.
Video
Accessing 2020 Census Redistricting Data from the Legacy Format Summary Files
Video
2020 Census Redistricting Data Release: What is Redistricting?
James Whitehorn and Nicholas Jones answer common questions about the upcoming 2020 Census data release.
Maps
Visualization
2020 Census Demographic Data Map Viewer
The 2020 Census Demographic Data Map Viewer is web map application that includes state, county, and tract-level data from the 2020 Census.
2020 Census P.L. 94-171 Redistricting Data Map Suite
Here you will find the 2020 Census P.L. 94-171 Redistricting Data Map Suite
TIGER/Line Shapefiles
View all the available mapping files from the Geography program.
America Counts Story
Improved Race, Ethnicity Measures Show U.S. is More Multiracial
Today’s release of 2020 Census data provides a new snapshot of the racial and ethnic composition of the country.
America Counts Story
2020 U.S. Population More Racially, Ethnically Diverse Than in 2010
2020 Census results released today allow us to measure the nation’s racial and ethnic diversity and how it varies at different geographic levels.
America Counts Story
What Do We Know About the Quality of 2020 Census Redistricting Data?
To assess the quality of the redistricting data released today, we compared 2020 Census to key data benchmarks.
America Counts Story
8.2 Million People Counted at U.S. Group Quarters in the 2020 Census
The 2020 Census data released today provide counts of the group quarters population down to the block level for the first time in a decade.
America Counts Story
Adult Population Grew Faster Than Total Population From 2010 to 2020
The first detailed results of the 2020 Census released today show a nationwide shift in the age makeup of the U.S. population from 2010 to 2020.
America Counts Story
Growth in Housing Units Slowed in the Last Decade
The 2020 Census results released today provide a count of vacant and occupied housing units across the nation.
America Counts Story
U.S. Housing Vacancy Rate Declined in Past Decade
The percentage of housing units vacant in 2020 dropped to 9.7% from 11.4% in 2010, according to 2020 Census data released this week.
America Counts Story
STATE PROFILES: 2020 Census
We bring you data visualizations with new 2020 Census data for your state and county on: population, race and ethnicity, diversity, age and housing.
Page Last Revised - October 8, 2021
✕
Is this page helpful?
 Yes
Yes
 No
No
 Yes
Yes
 No
No✕
NO THANKS
255 characters maximum
 255 characters maximum reached
✕
Thank you for your feedback.
Comments or suggestions?

Comments or suggestions?