2020 Census Results Released Today Are Generally in Line With Expectations
Today, the U.S. Census Bureau released the 2020 Census redistricting data that provide the first detailed counts and characteristics of the population for local geographies.
The 2020 Census encountered numerous data collection and operational challenges created by the COVID-19 pandemic — challenges that raised concern from key stakeholders and demographic experts over the quality of the data. The Census Bureau has been, and will continue to, release quality metrics to demonstrate the count’s quality.
Overall, we found that the 2020 Census results from the redistricting data are comparable to the population benchmarks we’ve examined.
Overall, we found that the 2020 Census results from the redistricting data are comparable to the population benchmarks we’ve examined.
We compared the 2020 Census results to key population data benchmarks — specifically the official population estimates of the April 1, 2020 population produced by our Population Estimates Program and the 2010 Census — which is one way to assess the quality of the 2020 Census Redistricting Data (P.L. 94-171) Summary File.
Comparing 2020 Census results to other population data benchmarks helps us gauge how similar the results are with these estimates. The quality of the data is critical because they may be used not only to redraw congressional and legislative districts but also to help allocate hundreds of billions of dollars in federal spending.
The redistricting data analyzed in this story cover several population groups — the total population (at the county level), the adult population (age 18 and over), and the racial and ethnic composition of the population.
More detailed information regarding the methodology and development of population estimates is available in this blog post: Comparisons to Benchmarks as a Measure of Quality.
Looking through the differences between the 2020 Census counts and benchmarks is the first step towards identifying future research that can dig deeper into the cause of the differences. Over the coming years, Census Bureau staff and other researchers will work to understand these differences.
For now, documenting the location and magnitude of differences is a crucial part of the research process.
County Population
In April of 2021, the Census Bureau released a report comparing state-level results from the 2020 Census to estimates it had previously produced.
Now, with the release of the county-level 2020 Census results, it is possible to do a similar comparison of how the 2020 Census counts compare to the April 1, 2020 population estimates made public earlier this year.
Even though differences between the 2020 Census and the April 1, 2020 population estimates are generally assumed to be error in the estimates, it is still a useful exercise, as it can help inform future research on the methodology used to produce the population estimates between decennial censuses.
When looking at numeric differences (census count minus population estimate), we see that over two-thirds (69.1%) of counties and Puerto Rico municipios were different by less than ±1,000 people (Table 1).
We also look at the percent differences between the 2020 Census counts and the April 1, 2020 population estimates—in other words, how much the count was above or below the population estimate, in percentage terms (Table 2).
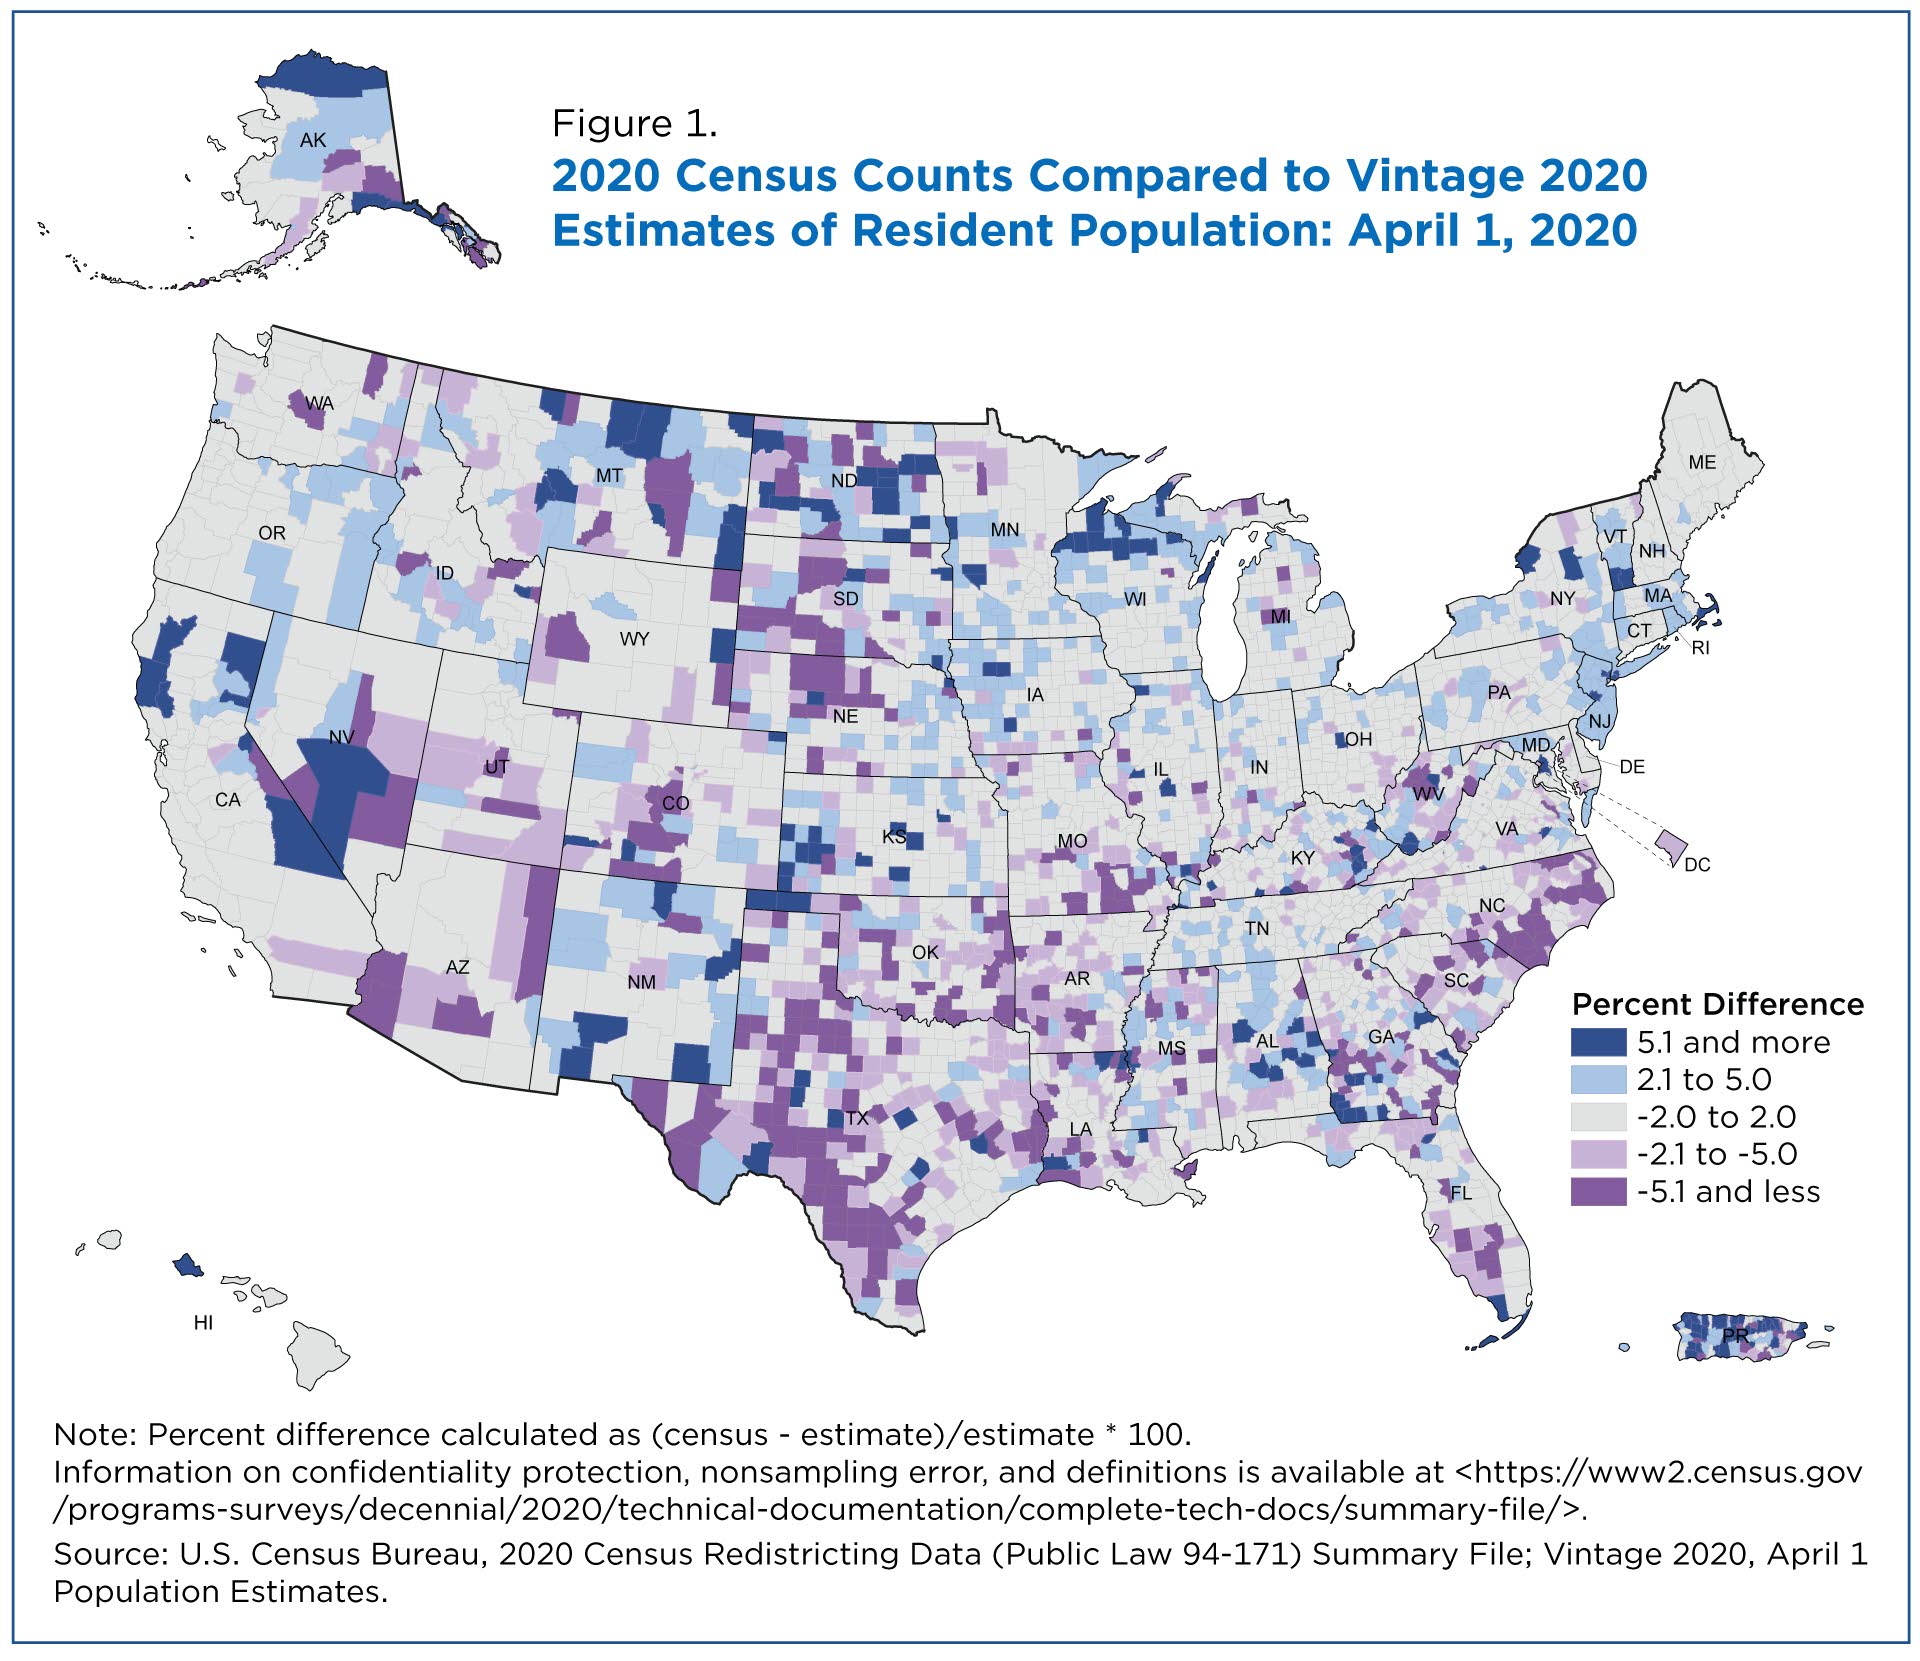
The pattern is similar when we look at percent differences: Most counties (53.8%) have 2020 Census counts within +/- 2.0% of the April 1, 2020 population estimates.
For comparison, in the Vintage 2010 population estimates 47.4% of counties (not including Puerto Rico) were within +/- 2.0% of the 2010 Census counts, indicating that the Vintage 2020 estimates and census counts were more closely aligned than in 2010.
There were some counties that were substantially different: 15.2% of counties were +/-5.1% or more different.
Percent differences are important to analyze since they’re relative to the size of the county and help us see patterns among smaller counties as well as the larger ones.
The map below shows how the percent differences were distributed across the United States.
There were pockets of counties in the Southwest, Southeast, and Puerto Rico that had 2020 Census counts that were somewhat lower than the April 1, 2020 population estimates. On the other hand, some areas in the Northeast, northern Midwest, and West had 2020 Census counts higher than the April 1, 2020 population estimates.
Population Aged 18 and Over
Note: Differences are calculated using unrounded values.
For the United States as a whole, the adult population — those aged 18 and over — in the 2020 Census was 258.3 million people, or 77.9% of the population.
In contrast, the April 1, 2020 population estimates indicate an adult population of 256.5 million, 1.9 million (0.7%) fewer people than the 2020 Census counts. The estimate for the population under age 18 of 72.9 million was approximately 200,000 fewer than the 2020 Census count.
Both the April 1, 2020 population estimates and the 2020 Census showed the adult population made up 77.9% of the total population.
The state with the largest difference in population aged 18 and over compared to the April 1, 2020 population estimates was New York, which had a population of 16.1 million — 0.7 million persons (4.7%) more in the 2020 Census than in the April 1, 2020 population estimates.
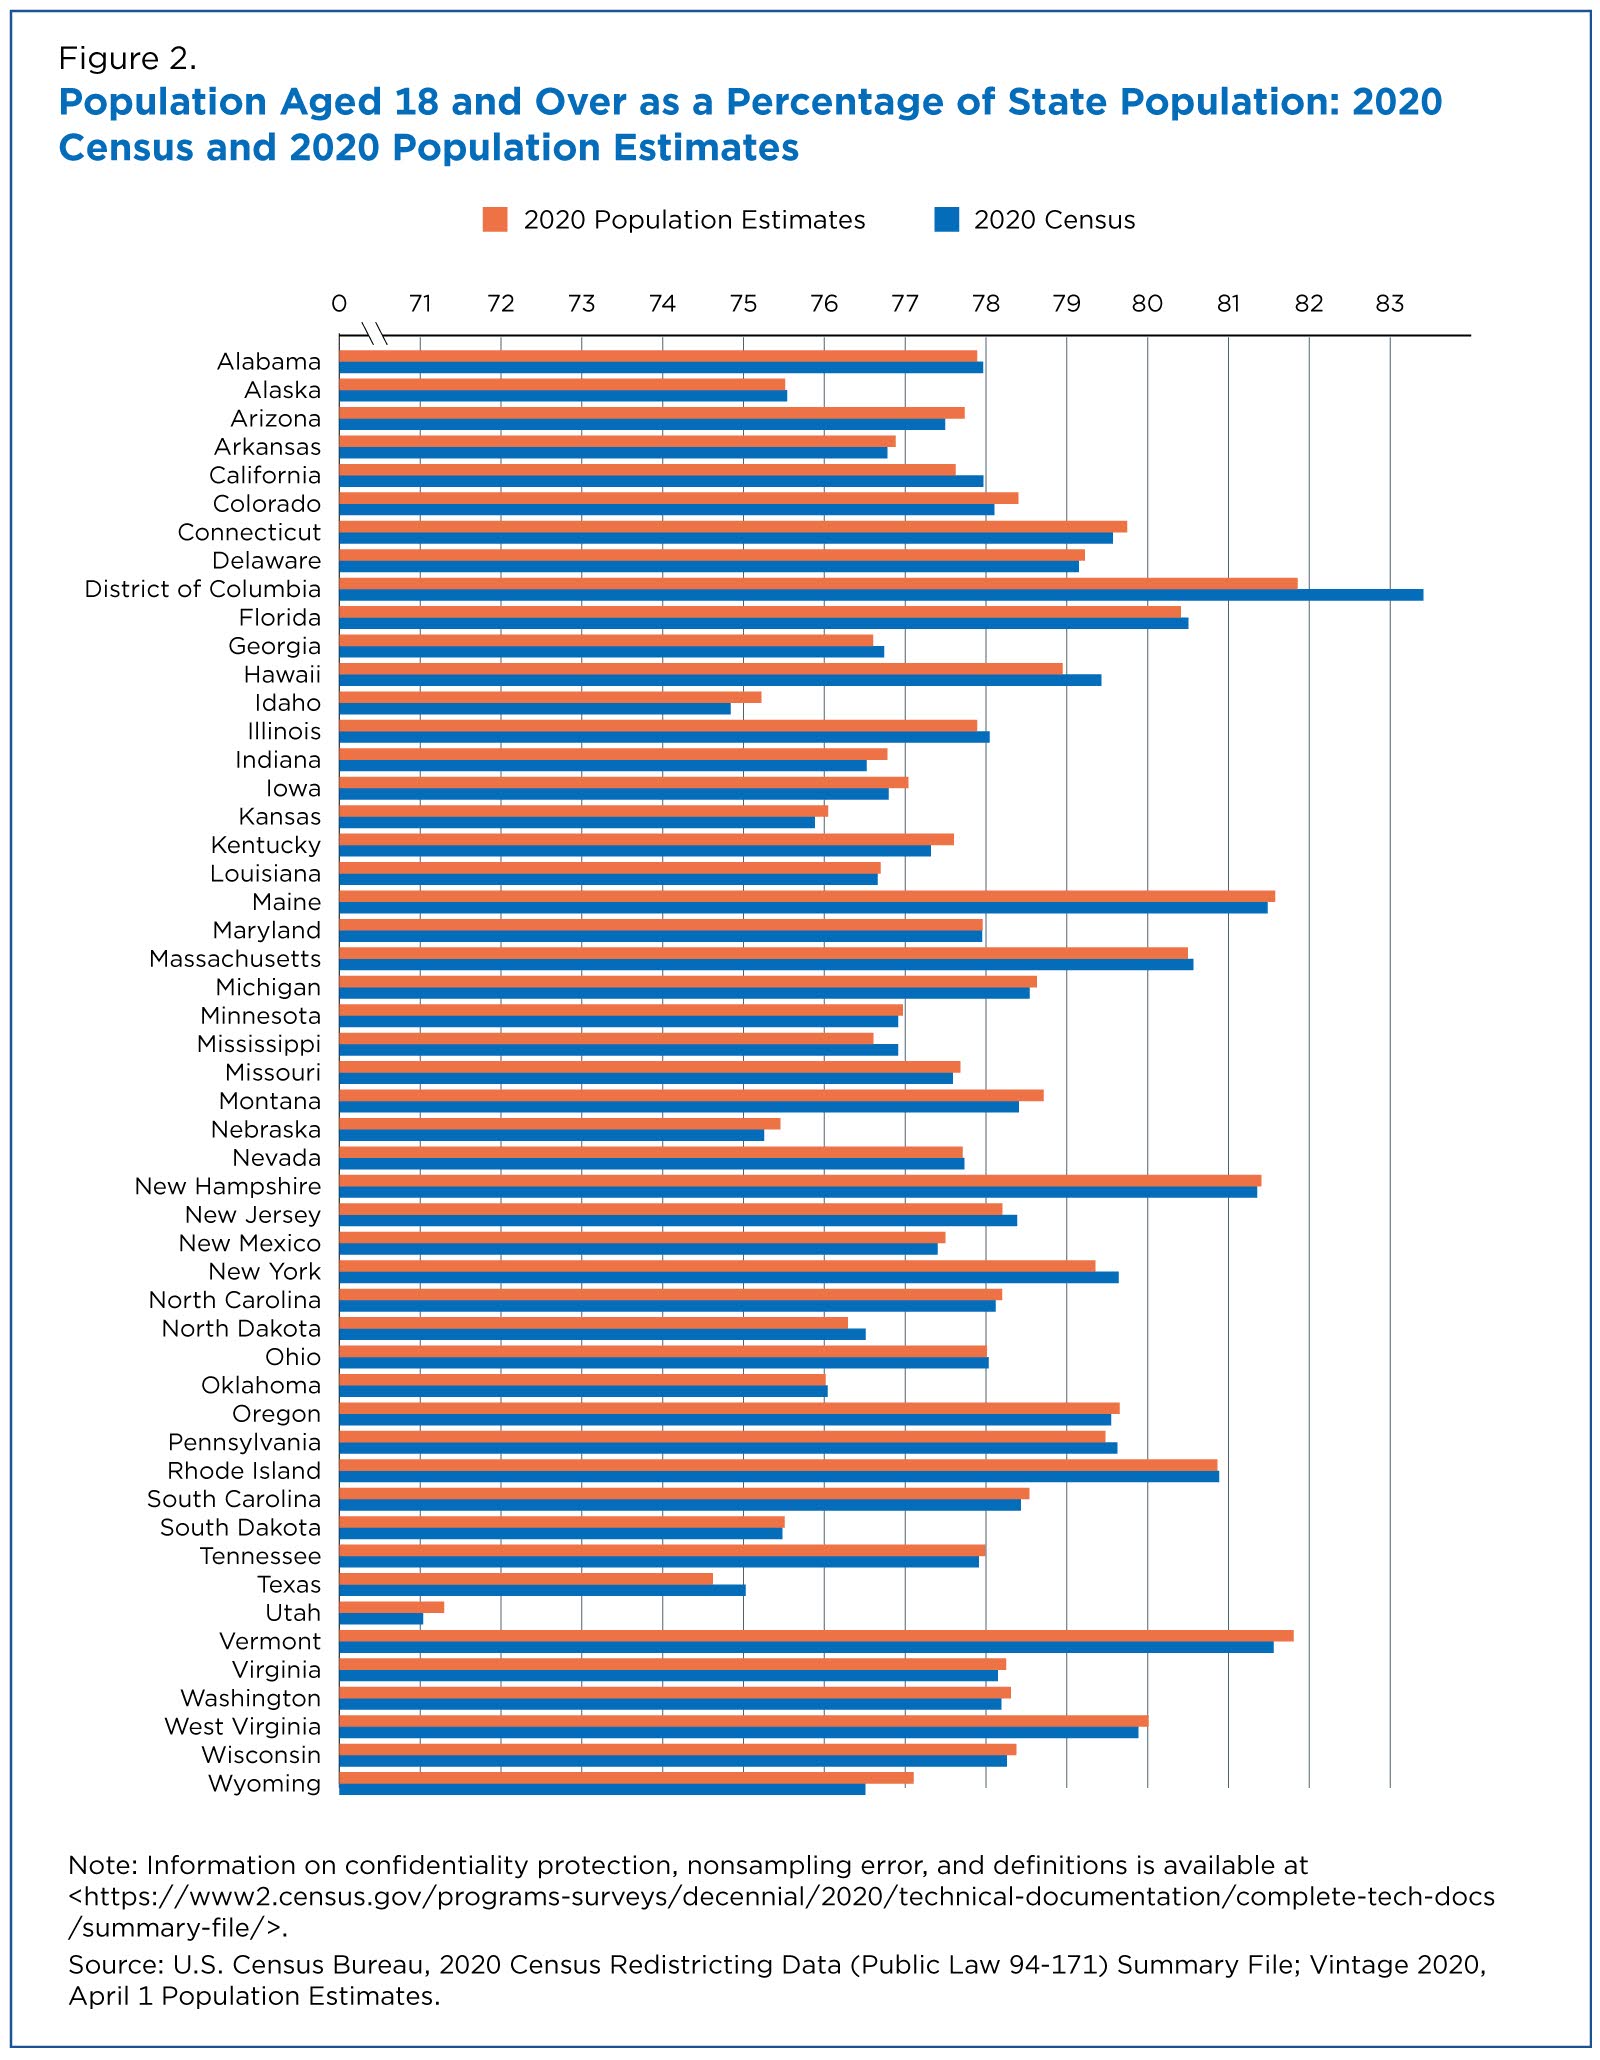
The District of Columbia had the largest difference in the proportion of the state population that was age 18 and over (Figure 2). The 2020 Census counts indicate that the District of Columbia had 83.4% of its population aged 18 and over while the April 1, 2020 population estimates put the proportion 1.6 percentage points lower at 81.9%. No other state differed by more than ±0.6 percentage points.
Population by Hispanic or Latino Origin
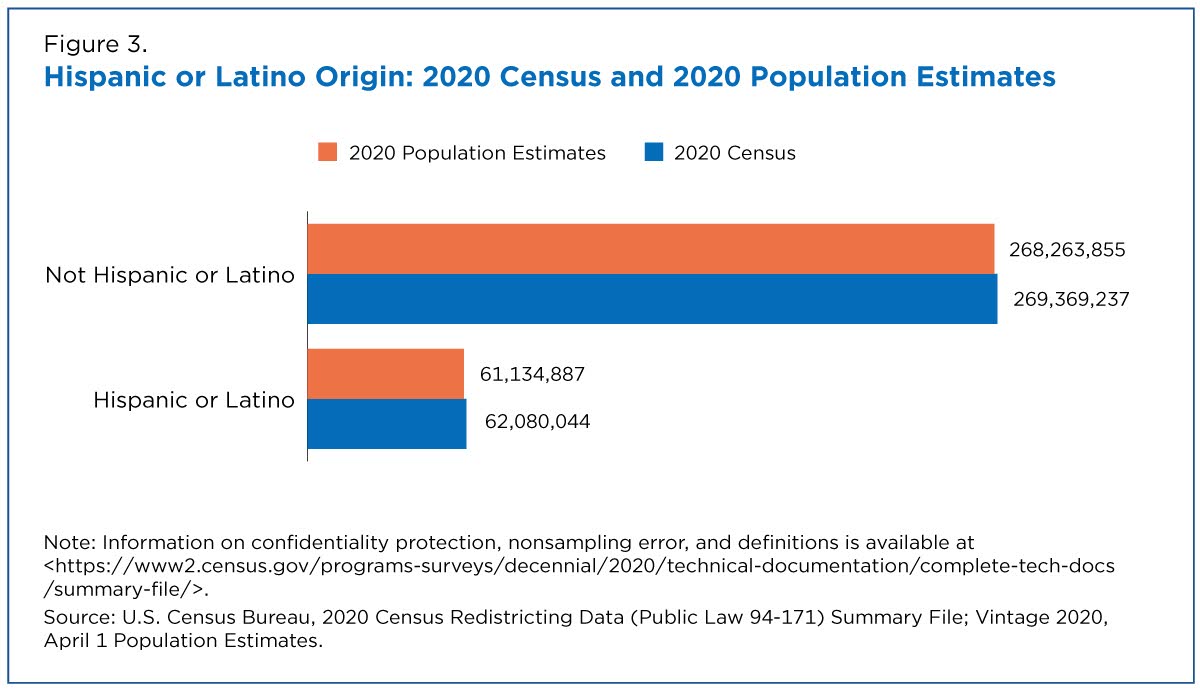
The 2020 Census Hispanic or Latino population (referred to as the Hispanic population in this story) was roughly 1 million larger than the April 1, 2020 population estimates, but the percentage distributions between the two data sets were very similar (Figure 3).
The Hispanic population was 18.6% of the population in the April 1, 2020 population estimates and 18.7% in the 2020 Census.
Forty states had a larger Hispanic population in the 2020 Census when compared to the April 1, 2020 population estimates (Figure 4).
Ten states and the District of Columbia had smaller Hispanic populations in the 2020 Census than in the estimates: Texas (-209,207), Arizona (-163,117), New Mexico (-34,476), Nevada (-29,336), Florida (-25,121), Hawaii (-15,129), Colorado (-7,056), Alaska (-3,795), Wyoming (-1,093), South Dakota (-595) and 3,229 fewer people in the District of Columbia (Table 3).
However, the percentage-point differences for the Hispanic population between the April 1, 2020 population estimates and the 2020 Census were each less than 2 percentage points for these ten states and the District of Columbia. In fact, seven states (Alaska, Colorado, Florida, Nevada, South Dakota, Texas, and Wyoming) and the District of Columbia each had less than 1 percentage-point difference.
Population by Race
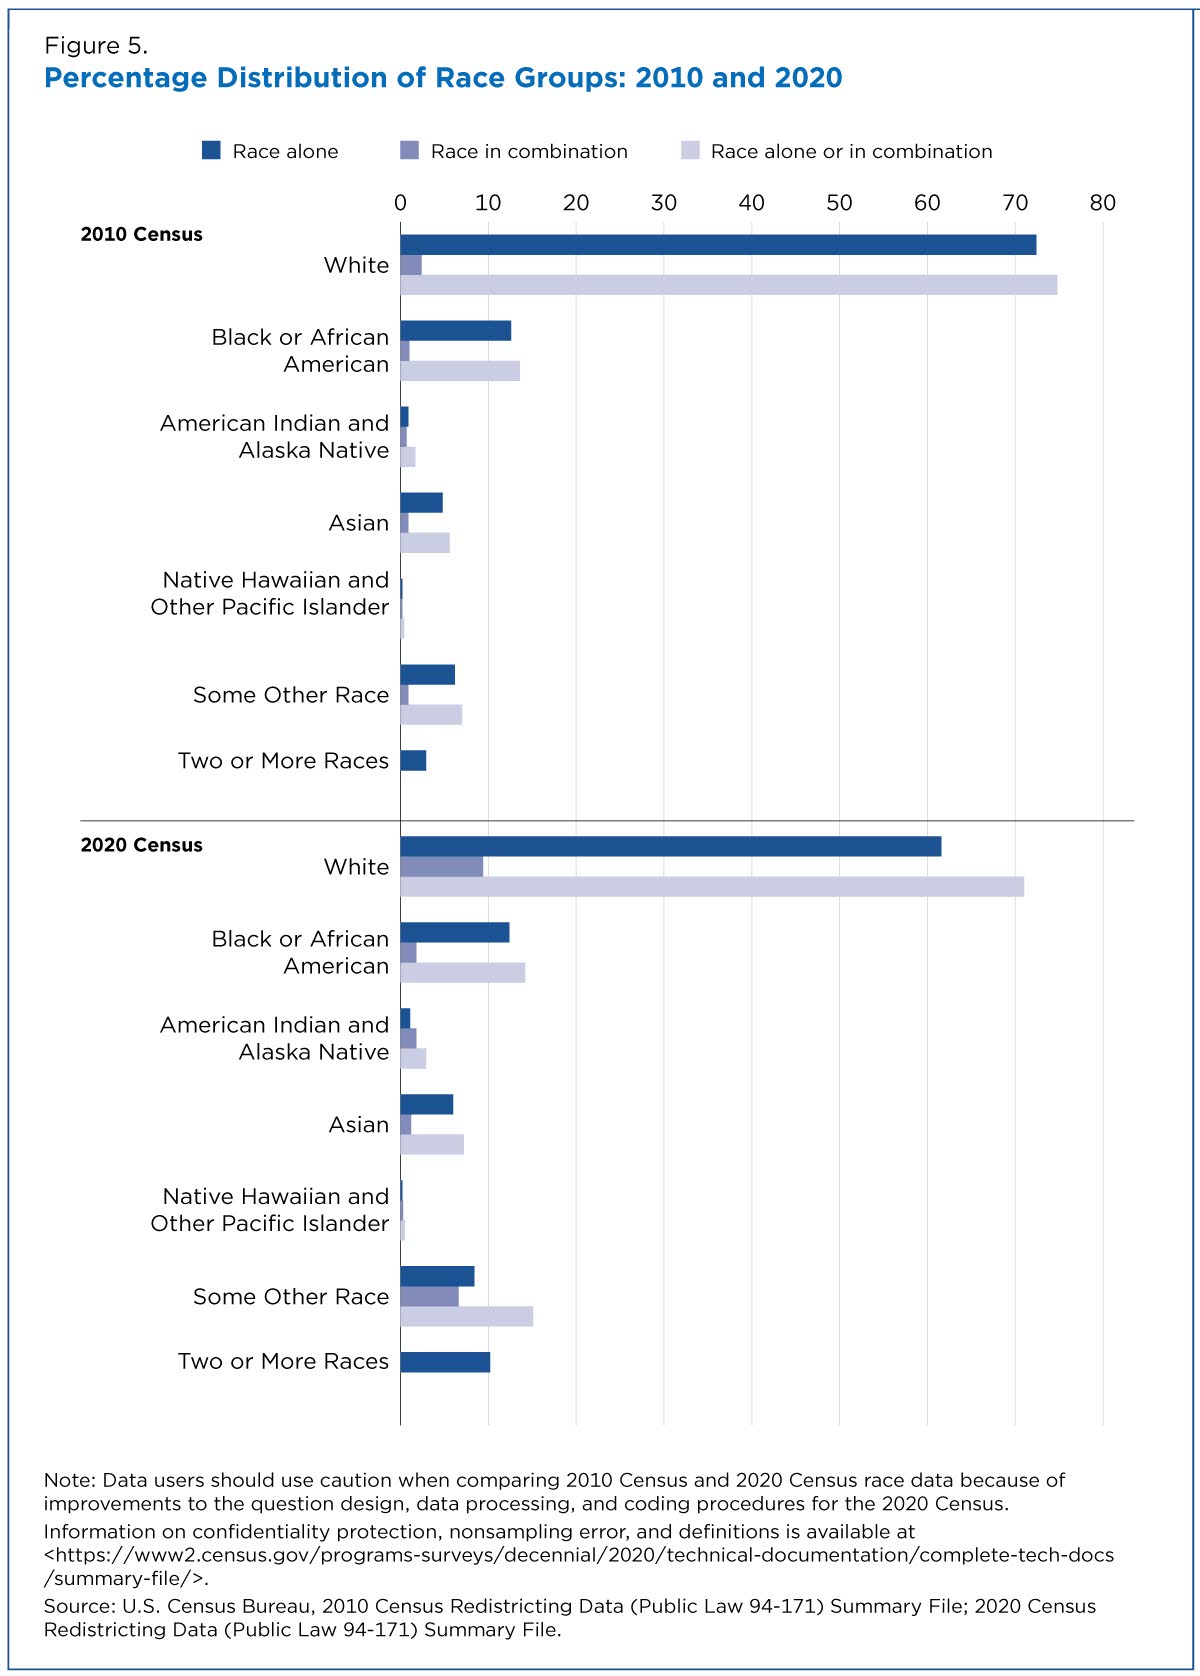
To assess the reasonableness of the race data, we compare the 2020 Census data to the 2010 Census data. Data from the Population Estimates Program do not include the Some Other Race category in its tabulations, so it is not comparable to decennial census data, which is why we are using the 2010 Census data for this comparison.
It is important to note that comparisons between the 2020 Census and 2010 Census race data should be made with caution, taking into account the improvements we have made to the Hispanic origin and race questions and the ways we code what people tell us.
We are confident that differences in the overall racial distributions are largely due to improvements in the design of the two separate questions for race data collection and processing, as well as some demographic changes over the past 10 years.
The 2020 Census used the required two separate questions (one for Hispanic or Latino origin and one for race) to collect the races and ethnicities of the U.S. population, following the standards set by the U.S. Office of Management and Budget (OMB) in 1997.
Building upon our research over the past decade, we improved the two separate questions design and updated our data processing and coding procedures for the 2020 Census. This work began in 2015 with our research and testing centered on findings from our 2015 National Content Test and the designs were implemented in the 2018 Census Test for the 2020 Census.
These improvements and changes yield a more accurate portrait of how people report their Hispanic origin and race within the context of a two-question format. These changes reveal that the U.S. population is much more multiracial and more diverse than what we measured in the past.
Data from the 2020 Census show different, but reasonable and expected distributions, from the 2010 Census for the Multiracial population, especially for people who self-identify as both White and Some Other Race.
Based on what we have learned through our research over the past decade, these results are not surprising, as they align with previous research findings about the impacts of question format on race and ethnicity reporting.
Population by Hispanic or Latino Origin and Race
Another way to assess the reasonableness of the Hispanic origin and race data is to look at the most prevalent race and ethnic groups in each county.
The racial and ethnic diversity America Counts story includes several county-level prevalence maps that show patterns are similar to what the 2010 Census showed.
Data from the 2020 Census show similar distributions for the race alone, non-Hispanic groups and the Hispanic population when compared to the 2010 Census. Because of the improvements to the design of the race question and the coding procedures made for the 2020 Census, we see expected changes for the Multiracial population, especially for people who self-identify as both White and Some Other Race.
These results are not surprising as they align with our research findings this past decade about the impacts of question format on race and ethnicity reporting.
What Benchmarking Tells Us About 2020 Census Data
Overall, the 2020 Census results are in line with the April 1, 2020 population estimates, which were released to the public last month. In our analysis, we found:
- The total population census counts by county are generally close to the April 1, 2020 population estimates from our annual Population Estimates Program.
- The population aged 18 and over in the 2020 Census is also consistent with the April 1, 2020 population estimates.
- The national and state Hispanic Origin counts from the 2020 Census are also consistent with the April 1, 2020 population estimates.
- The distribution of race from the 2020 Census shows expected changes in some groups when compared to the 2010 Census. This aligns with our previous research findings that showed higher Multiracial reporting, particularly for the White and Some Other Race populations.
- These results are not surprising as they align with our expert research and corresponding findings this past decade, particularly with the results of the 2015 National Content Test, about the impacts of question format on race and ethnicity reporting. We are confident that differences in the overall racial distributions are largely due to improvements in the design of the two separate questions for race data collection and processing as well as some demographic changes over the past 10 years. We are also confident, as shown in our research over the past decade, that using a single combined question for race and ethnicity in the decennial census would ultimately yield an even more accurate portrait of how the U.S. population self-identifies, especially for people who self-identify as multiracial or multiethnic.
This analysis comparing 2020 Census results with other measures of the population represents just one of the many efforts underway to evaluate the quality of the 2020 Census.
All the authors are in the Census Bureau’s Population Division:
Roberto Ramirez is assistant division chief for Special Population Statistics.
Christine Borman is a statistician demographer in the Count Review Office.
Luke Rogers is the branch chief of the Population Estimates Branch.
Andrew Roberts is the branch chief of the Sex and Age Statistics Branch.
Rachel Marks is the branch chief of the Racial Statistics Branch.
Jessica Peña is a survey statistician in the Ethnicity and Ancestry Branch.
Alli Coritz is a survey statistician in the Ethnicity and Ancestry Branch.
Subscribe
Our email newsletter is sent out on the day we publish a story. Get an alert directly in your inbox to read, share and blog about our newest stories.
Contact our Public Information Office for media inquiries or interviews.
Redistricting & Voting Rights Data Office (RDO)
Visualizations
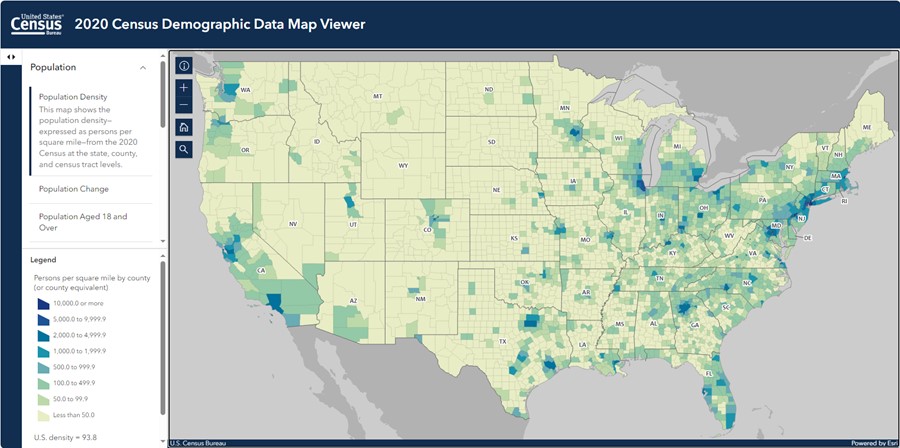
2020 Census Demographic Data Map Viewer is a web map application that includes state-, county-, and census tract-level data from the 2020 Census.
Data
Fact Sheets
Blog Posts
Newsroom
Census Academy
View training resources for 2020 Census data.
Videos
Maps
-
2020 Census Demographic Data Map ViewerThe 2020 Census Demographic Data Map Viewer is web map application that includes state, county, and tract-level data from the 2020 Census.
-
2020 Census P.L. 94-171 Redistricting Data Map SuiteHere you will find the 2020 Census P.L. 94-171 Redistricting Data Map Suite
-
TIGER/Line ShapefilesView all the available mapping files from the Geography program.
-
America Counts StoryImproved Race, Ethnicity Measures Show U.S. is More MultiracialAugust 12, 2021Today’s release of 2020 Census data provides a new snapshot of the racial and ethnic composition of the country.
-
America Counts Story2020 U.S. Population More Racially, Ethnically Diverse Than in 2010August 12, 20212020 Census results released today allow us to measure the nation’s racial and ethnic diversity and how it varies at different geographic levels.
-
America Counts StoryMore Than Half of U.S. Counties Were Smaller in 2020 Than in 2010August 12, 2021The U.S. Census Bureau today released the first 2020 Census population counts for counties, metropolitan and micropolitan statistical areas, and cities.
-
America Counts Story8.2 Million People Counted at U.S. Group Quarters in the 2020 CensusAugust 12, 2021The 2020 Census data released today provide counts of the group quarters population down to the block level for the first time in a decade.
-
America Counts StoryAdult Population Grew Faster Than Total Population From 2010 to 2020August 12, 2021The first detailed results of the 2020 Census released today show a nationwide shift in the age makeup of the U.S. population from 2010 to 2020.
-
America Counts StoryGrowth in Housing Units Slowed in the Last DecadeAugust 12, 2021The 2020 Census results released today provide a count of vacant and occupied housing units across the nation.
-
America Counts StoryU.S. Housing Vacancy Rate Declined in Past DecadeAugust 12, 2021The percentage of housing units vacant in 2020 dropped to 9.7% from 11.4% in 2010, according to 2020 Census data released this week.
-
America Counts StorySTATE PROFILES: 2020 CensusWe bring you data visualizations with new 2020 Census data for your state and county on: population, race and ethnicity, diversity, age and housing.
-
IncomeHow Income Varies by Race and GeographyJanuary 29, 2026Median income of non-Hispanic White households declined in five states over the past 15 years: Alaska, Connecticut, Louisiana, Nevada, and New Mexico.
-
HousingRental Costs Up, Mortgages Stayed FlatJanuary 29, 2026Newly Released American Community Survey compares 2020-2024 and 2015-2019 housing costs by county.
-
HousingShare of Owner-Occupied, Mortgage-Free Homes Up in 2024January 29, 2026The share of U.S. homeowners without a mortgage was higher in 2024 than a decade earlier nationwide and in every state, though not all counties saw increases.
-
PopulationU.S. Population Growth Slowest Since COVID-19 PandemicJanuary 27, 2026The decline in international migration was felt across the states, though its impact varied.


