Transitions in Health Insurance Coverage: A Look Inside Annual Health Coverage Statistics
Transitions in Health Insurance Coverage: A Look Inside Annual Health Coverage Statistics
Annual estimates of health coverage from the Current Population Survey Annual Social and Economic Supplement (CPS ASEC) highlighted in the report Health Insurance Coverage in the United States: 2020 paint a broad picture of the nation’s health care landscape. The report considers people to be uninsured if they were not covered by any type of insurance for the entire year. Within a calendar year, individuals may be uninsured only part of the year. Those who are uninsured for part (one to 11 months) of the year may have lost health coverage, transitioned to health coverage, or experienced multiple transitions. Understanding within-year transitions in health coverage — who loses or gains coverage and for how long — provides a more nuanced portrait of the nation’s health care needs and well-being.
As a result of a redesign in 2014, the CPS ASEC questionnaire includes questions that probe whether respondents had continuous coverage (and, if not, which months they had it) and if they experienced any coverage changes. While these questions are included for the purpose of improving the calendar year measure, a recent working paper, Evaluating Subannual Health Insurance Coverage Estimates in the Current Population Survey Annual Social and Economic Supplement examines the estimates of subannual coverage to assess what the survey can add to the understanding of transitions to and from health coverage.
Comparing Subannual Coverage in the CPS ASEC With Other Surveys
The working paper compares subannual estimates of health insurance coverage from the CPS ASEC with two other surveys for calendar years 2017 and 2018. The Medical Expenditure Panel Survey (MEPS) and the Survey of Income and Program Participation (SIPP) both produce monthly estimates for health insurance coverage by type. The paper explores differences in the survey methods and operations to give context to the estimates. The paper does not attempt to assess the accuracy of reporting coverage and transitions in coverage across the surveys.
The evaluation found significant differences in the number of health insurance transitions and duration of spells across surveys, with the CPS ASEC showing fewer transitions into or out of uninsured status than MEPS. Some of these differences may be due to design differences across surveys, including a longer retrospective recall period for the cross-sectional CPS ASEC compared to MEPS.
Given the differences between the surveys, researchers should use caution in interpreting subannual coverage and health insurance transitions in the CPS ASEC. Despite its larger sample size and rich demographic detail, the infrequency of coverage transitions and stability in insurance status reported in the cross-sectional CPS ASEC poses challenges for subgroup analysis or analysis for transitions between subtypes of coverage. Yet, examining subannual coverage in the context of the COVID-19 pandemic and the recent recession may highlight how health coverage and health care needs changed during the pandemic.
Subannual Health Insurance Coverage in the CPS ASEC: 2018 and 2020
Using recent estimates of subannual coverage in the CPS ASEC, Figure 1 shows changes in summary measures between 2018 and 2020. (As noted in the report released today, data for 2018 were collected in 2019 before the COVID pandemic and its associated changes to data collection. The 2020 data were collected in 2021, when some of the COVID-19 pandemic-related data collection changes were lifted.) Similar to the results in the evaluation paper, these estimates reflect the relative stability of coverage reported in the CPS ASEC.
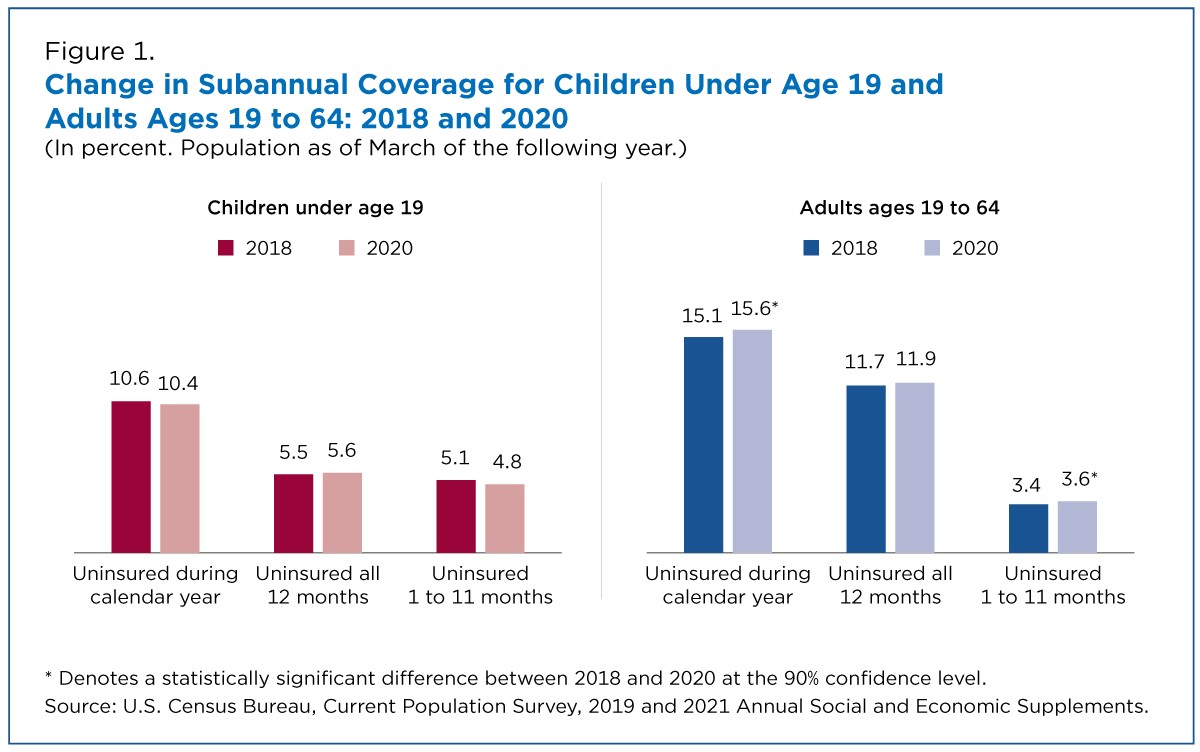
Between 2018 and 2020, the CPS ASEC showed no change in the percentage of children who were uninsured at any time during the calendar year. Further, there was no significant change in the percentage of children under age 19 who had no health coverage for all or part of this period.
In contrast, the proportion of adults ages 19 to 64 who were uninsured at any point during the calendar year increased from 15.1% in 2018 to 15.6% in 2020.
People may be uninsured part of the year because they lose health coverage during the year or are uninsured in the beginning of the year and obtain coverage later through their or a family member’s employer, a government program, or by purchasing coverage. Others may experience multiple changes in coverage status throughout the course of the year. Of the estimated 7.1 million working-age adults (3.6% of all working-age adults) experiencing a coverage change in 2020, fewer than 3.3 million (1.7%) reported losing coverage at some point during the year. This suggests that more people gained than lost coverage during the year.
Stability in subannual coverage measures may mask differences in transitions in coverage across groups. The economic shock associated with the COVID-19 pandemic increased unemployment, and workers losing their jobs were more vulnerable to losing health coverage.
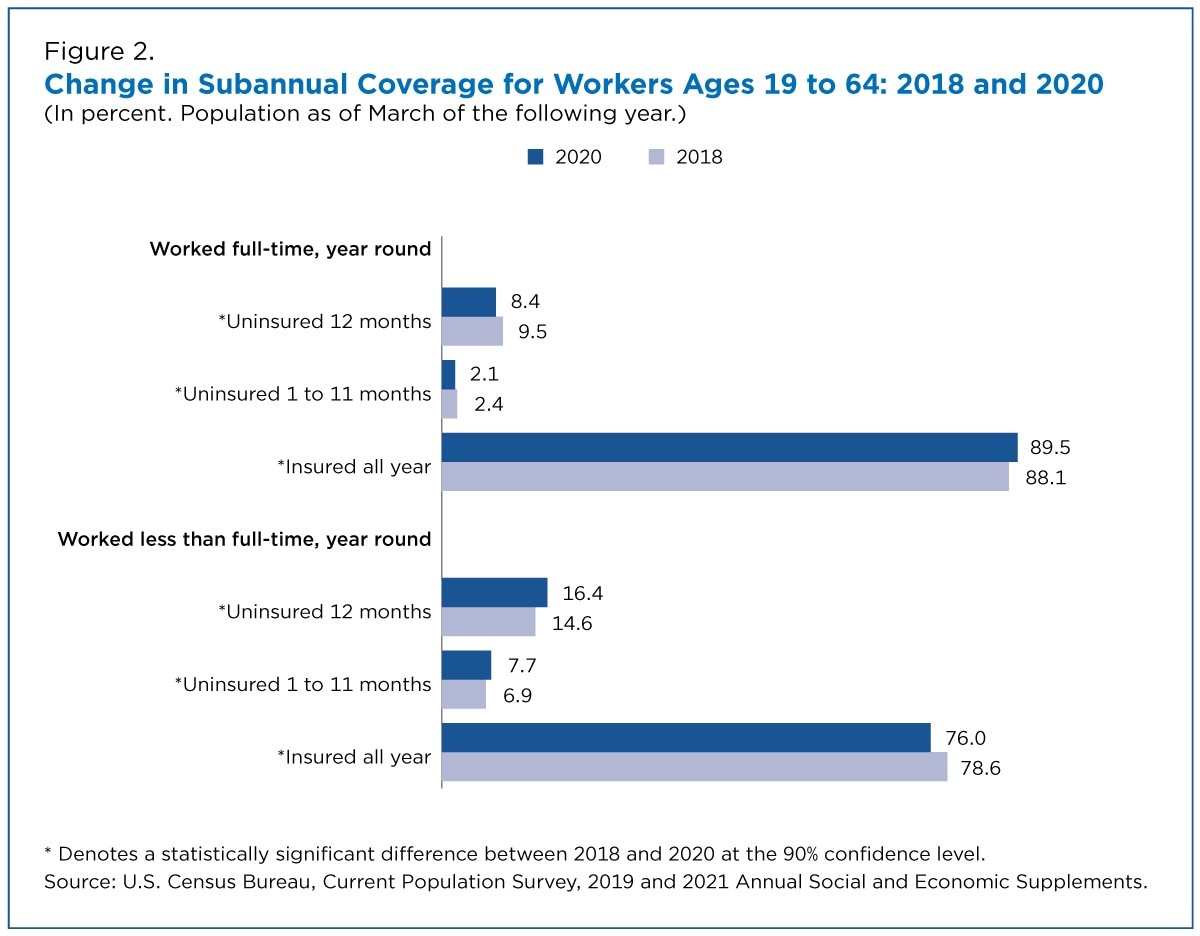
These layoffs may be reflected in the decline in full-time employment between 2018 and 2020. The number of full-time, year-round workers (those working 35 hours or more a week at least 50 weeks of the year) fell by about 12.3 million to an estimated 99.2 million between 2018 and 2020. The BLS report, “Employment recovery in the wake of the COVID-19 pandemic,” states that full-time, year-round workers in 2020 were more likely to have been in essential industries or to have had remote work options. These latter workers also tended to be older, married and more educated. As a result, the percentage of full-time, year-round workers ages 19 to 64 with health insurance coverage for all 12 months increased by 1.4 percentage points to 89.5% from 2018 and 2020 (Figure 2).
Although some workers may have opted to work part-time, layoffs due to the pandemic may have contributed to an increase in the number of workers ages 19 to 64 employed less than full-time, year-round, from 39.5 million to 51.4 million between 2018 and 2020. Workers working less than full time, year-round may be more vulnerable to losing health coverage. In 2020, the uninsured rate for these workers rose 1.8 percentage points to 16.4%.
The number and percentage of workers experiencing a transition in coverage (uninsured one to 11 months) during the year also rose by 0.8 percentage points to 7.7% of workers employed less than full-time, year-round. About 4.1% of these workers lost and 4.9% gained coverage during the year. Therefore, this also represents part-year workers not covered in January who may have gained coverage through employment, qualified for public coverage, or purchased coverage through the marketplace or from another source during the year.
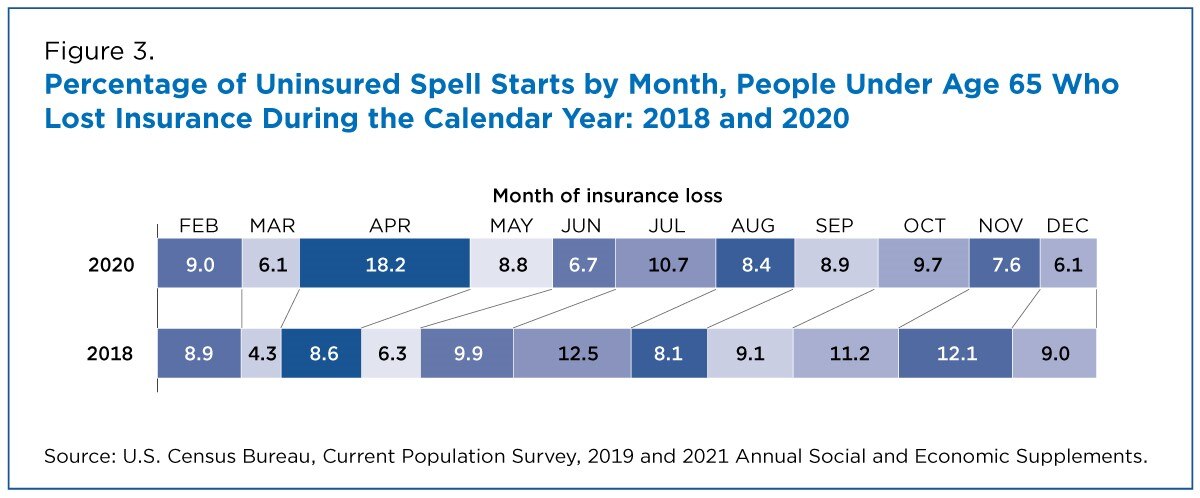
Although the CPS ASEC reveals relative stability in coverage status across the calendar year, even during the global pandemic of 2020, one can compare the timing of uninsured spells among people under age 65 who lost insurance during the year across survey years. As seen in Figure 3, July and November each accounted for about 12% of uninsured spell starts in 2018; in 2020, nearly 20% of uninsured spells began in April, reflecting the timing of shutdowns and early employment losses resulting from the COVID-19 pandemic in the United States.
Results from 2018 and 2020 suggest some differences across groups in the incidence of transitions. Further, an examination of spell timing highlights the impact of the pandemic. Yet, the relative stability of coverage in 2018 and 2020 suggests researchers should use caution in exploring health insurance dynamics in the CPS ASEC. However, as noted in prior research, these subannual measures have improved measurement of annual health insurance coverage in the CPS ASEC.
This blog is designed to inform interested parties of research and to encourage discussion. The views expressed on statistical or methodological issues are those of the authors and not necessarily of the U.S. Census Bureau. It has undergone review by a Census Bureau Disclosure Avoidance Officer (CBDRB-FY21-POP001-019).
Laryssa Mykyta is chief and Katherine Keisler-Starkey an economist in the Census Bureau’s Health and Disability Statistics Branch.