How Apportionment is Calculated
How Apportionment is Calculated
In another blog, we talked about the apportionment population counts and what to expect on the day they are released as part of the first 2020 Census results. In this blog, we will talk about how we calculate the apportionment of seats in the U.S. House of Representatives.
The Constitution requires that each state have a minimum of one seat in the U.S. House of Representatives. The apportionment calculation is then used to distribute the remaining 385 seats among the 50 states.
Congress decides the method used to calculate apportionment, and the method has changed over time. Congress adopted the current method, the Method of Equal Proportions, in 1941. It was first used after the 1940 Census and has been used after each subsequent census, as mandated in Title 2, United States Code.
A high-level visual explanation is available in the apportionment video. It describes the purpose and importance of apportionment, and it explains that the apportionment formula ensures equal representation across the 50 states.
Method of Equal Proportions
Mathematically speaking, the goal of the Method of Equal Proportions is to minimize the relative (or percentage) differences in representation (the number of people per representative) among the states.
In practice, we use this method to determine the number of seats each state receives by:
- Calculating a set of “priority values” for each state, based on the state’s apportionment population.
- Sorting those values from largest to smallest.
- Allocating a seat to a state each time one of its priority values is included in the largest 385 values in the list (An example of this process is available in the Priority Values for 2010 Census table).
We calculate the priority values by dividing the state’s apportionment population by the geometric mean of its theoretical current and next seats.
The formula for calculating priority values is as follows:
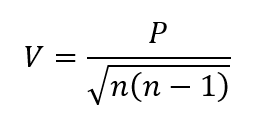
- V represents a priority value.
- P represents a state’s apportionment population.
- n represents the number of seats a state would have if it gained a seat.
Because all states automatically receive one seat, we start with “seat one” being the current seat, and “seat two” being the next seat. The priority value for each seat follows this pattern:
- The priority value for a state’s “seat two” equals its apportionment population divided by the square root of 2(2-1).
- The priority value for a state’s “seat three” equals its apportionment population divided by the square root of 3(3-1).
- And so on.
We need to calculate enough priority values for each state to account for the largest possible number of seats any one state could theoretically receive. California, the most populous state, currently has 53 seats. Therefore, out of an abundance of caution, we calculate priority values for each state’s potential seat numbers 2 through 70. This leads to a total of 3,450 priority values that we rank to identify the largest 385 values, and then we determine which states and seat numbers those values belong to.
Verification
To ensure accuracy, multiple selected staff members from different areas of the Census Bureau each independently wrote their own program code to calculate apportionment using the Method of Equal Proportions. Among these programmers, there are four different types of software being used (SAS, R, Python Anaconda, and Oracle PL SQL).
After they all separately run their programs, the results are verified by additional staff members who compare the output data from each independent programmer to ensure all results match. This entire calculation and verification process is very similar to the process used to produce the 2010 Census apportionment results, and it has been extensively tested multiple times over the past two years.
Other Apportionment Resources
The 2020 Census apportionment tables and maps, along with a suite of supplemental materials, will be available in the 2020 Census Apportionment press kit by the end of the news conference announcing the release of the apportionment data.
For another detailed description of how the Method of Equal Proportions is used to calculate the apportionment of seats in the U.S. House of Representatives, you can visit our Computing Apportionment webpage.