More Than Half of U.S. Population in 4.6 Percent of Counties
State population numbers reveal how many people live in each state, but one of the keys to understanding the complexities of the U.S. population distribution is to look at where people live.
At the county level, the geographic distribution of the estimated 325.2 million people in the United States clearly distinguishes two main areas where people live: “big” counties and “small” counties.
More than half of all residents live in just 143 big counties (in terms of the number of residents), according to an analysis of U.S. Census Bureau county estimates. That means less than half of the population is spread out across the remaining 2,999 small counties.
The range of population size of “small county America” and “big county America” is given in Table 1, and Table 2 shows how these counties are distributed across size categories.
Table 1: Range of population size among small and large counties
| Small Counties | Large Counties |
|
| Number of counties | 2,999 | 143 |
| Smallest population | 88 |
485,846 |
| Largest population | 476,015 |
10,137,915 |
| Median population | 23,999 | 821,725 |
Table 2: Distribution of small and large counties by population in 2016
| Size range | Small Counties | Large Counties |
| 0-4999 |
308 |
0 |
| 5000-19,999 | 1006 |
0 |
| 20,000-99,999 |
1233 | 0 |
| 100,000-499,999 |
452 | 5 |
| 500,000-999,999 | 0 | 94 |
| 1,000,000+ | 0 | 44 |
The five smallest counties in the nation and the five largest are listed in Tables 3 and 4, respectively.
Table 3: Five smallest US Counties
| County | State | Pop. |
| Kalawao | Hawaii | 88 |
| Loving | Texas | 113 |
| King | Texas | 289 |
| Kenedy |
Texas | 404 |
| Arthur | Nebraska | 469 |
Table 4: Five largest US Counties
| County | State | Pop. |
| Los Angeles |
California |
10,137,915 |
| Cook | Illinois |
5,203,499 |
| Harris | Texas | 4,589,928 |
| Maricopa |
Arizona | 4,242,997 |
| San Diego | California | 3,317,749 |
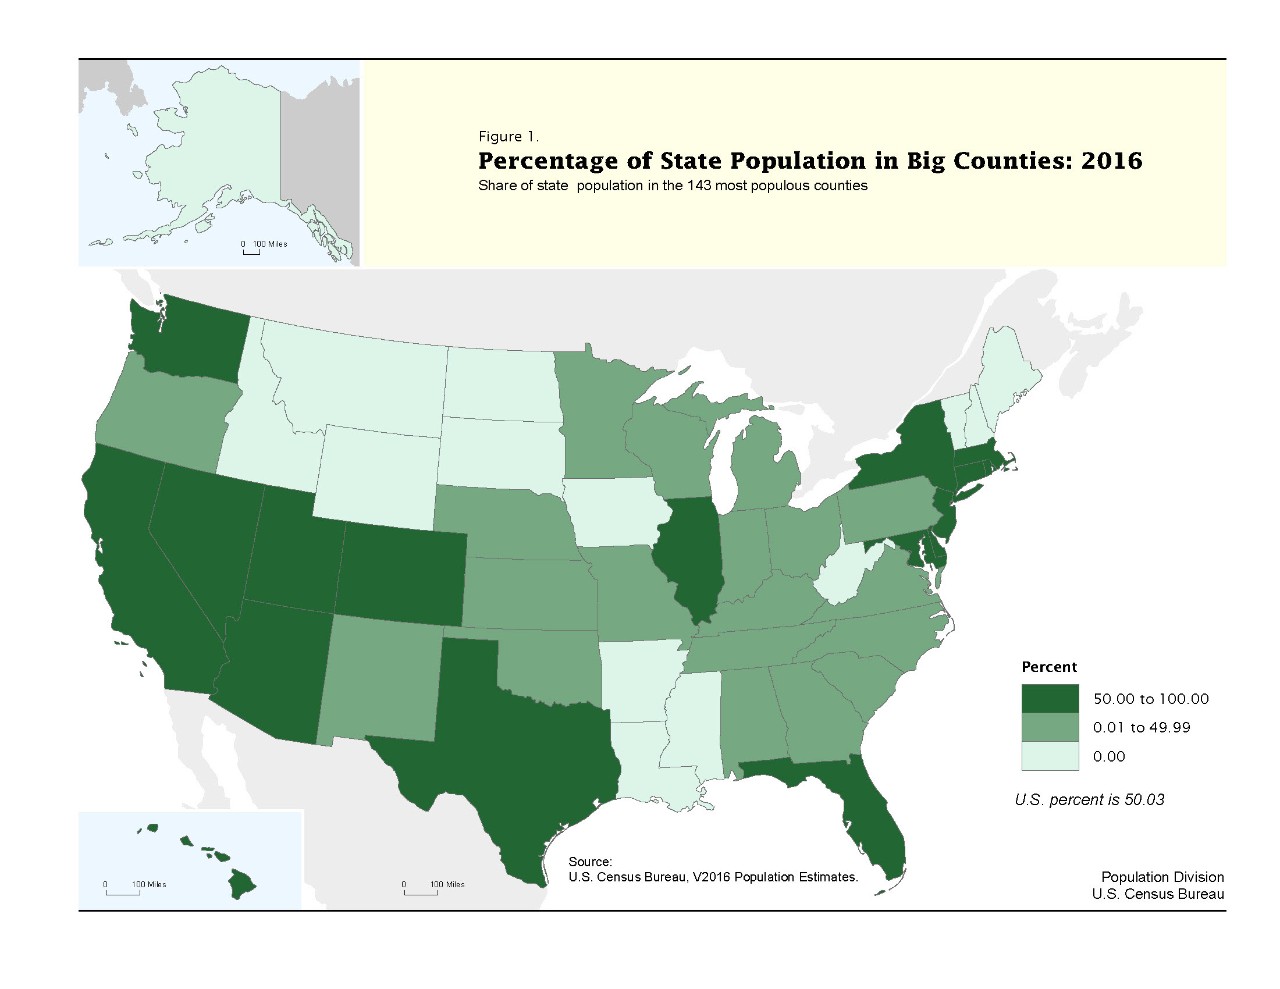
“Fourteen states don’t have any of the big counties,” said Larry Sink, Census demographer, who analyzed the data released June 22. They include: Alaska, Arkansas, Idaho, Iowa, Louisiana, Maine, Mississippi, Montana, New Hampshire, South Dakota, North Dakota, Vermont, West Virginia and Wyoming.
By contrast, there are 17 states where a majority of the population resides in big counties, as shown in Figure 1. In California, for example, more than 85 percent of residents (33.5 million) live in big counties. Ten million people live in Los Angeles, the nation’s most populous county.
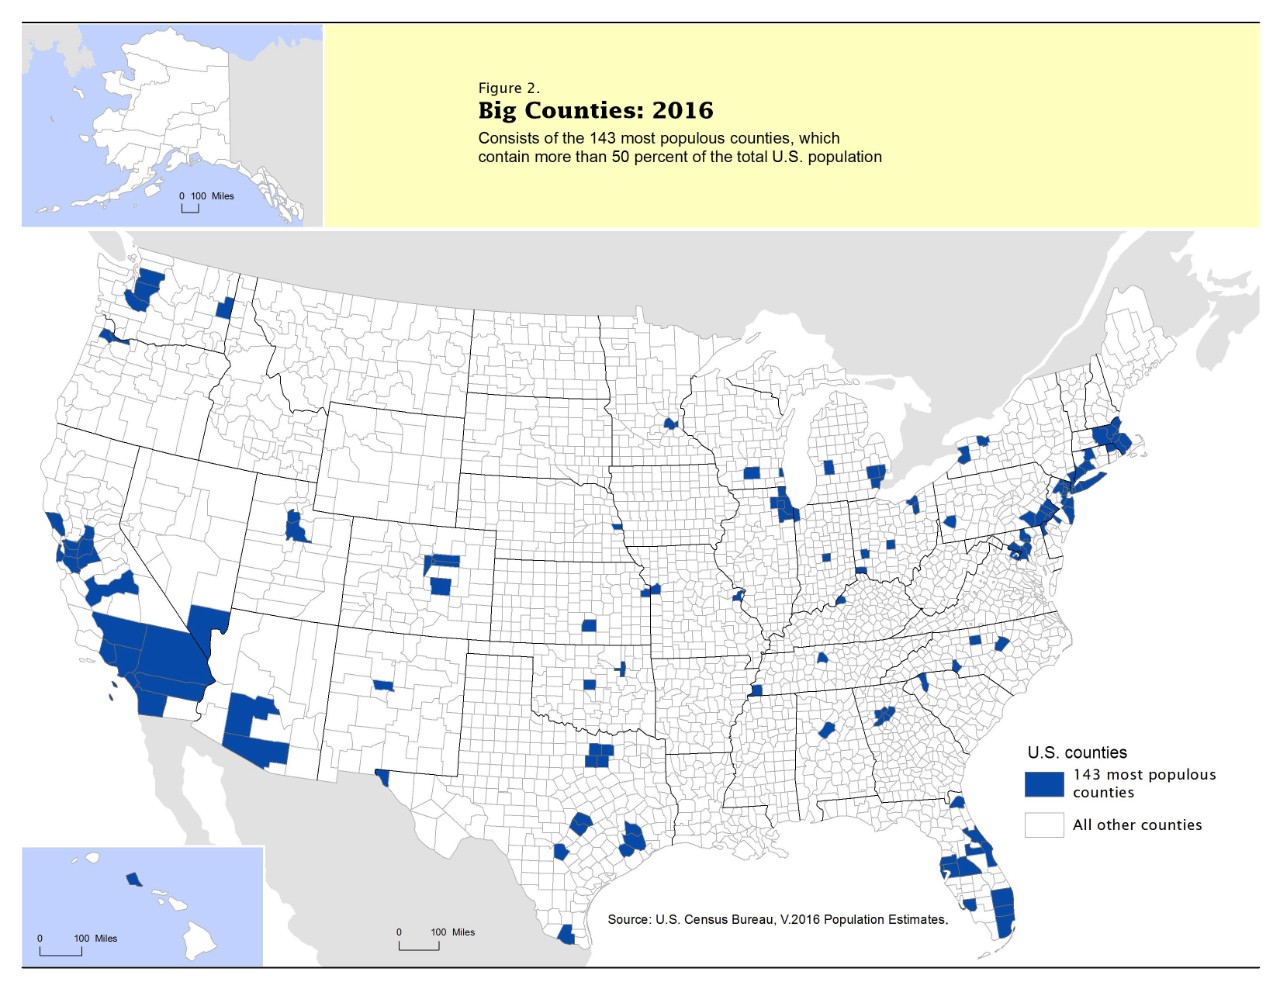
“We see a predominance of these big counties on the east and west coasts,” Sink said. “Small counties are more commonly found in inland areas.” This is similar to demographic patterns commonly seen around the world. The map in Figure 2 shows how these counties are distributed across the country.
“The most populous counties are often transportation hubs and major ports,” Sink said. “The small counties are mostly found in landlocked areas in the Great Plains, mountains and deserts. It’s not uncommon for these counties to even be losing population over time.”
There is also a difference in racial and ethnic diversity. For example, 79 percent of Asians, 71 percent of Hispanics and 59 percent of blacks live in big counties. Small-county America is nearly three-quarters non-Hispanic white, whereas this group makes up less than half of big-county America.
The differences between the two geographies also extend to age. The median age in small-county America is 39.1 compared with 36.9 for big-county America, and 54 percent of people age 65 or older live in small-county America.
There is also a notable difference in the rate of growth. “Big-county America is growing nearly twice as fast as small-county America,” Sink said. “They’re not only getting bigger but increasingly more diverse.” Thus, if current trends continue, it’s likely that the divide between big and small will continue to become more pronounced in the future.
Subscribe
Our email newsletter is sent out on the day we publish a story. Get an alert directly in your inbox to read, share and blog about our newest stories.
Contact our Public Information Office for media inquiries or interviews.
-
PopulationWe Are a Changing Nation: A Series on Population TrendsAugust 09, 2017Population patterns are shaped by three basic events: Births, deaths, migration.
-
PopulationWhat's in a Name?August 09, 2017The five most frequent surnames in 2010 remained mainly reported by whites and blacks but Hispanic surnames rose in popularity.
-
PopulationWhere The Babies Are BoomingSeptember 27, 2017Younger populations usually mean more births. The five states with the most births account for 10 percent of the U.S. population but 12 percent of the births.
-
IncomeHow Income Varies by Race and GeographyJanuary 29, 2026Median income of non-Hispanic White households declined in five states over the past 15 years: Alaska, Connecticut, Louisiana, Nevada, and New Mexico.
-
HousingShare of Owner-Occupied, Mortgage-Free Homes Up in 2024January 29, 2026The share of U.S. homeowners without a mortgage was higher in 2024 than a decade earlier nationwide and in every state, though not all counties saw increases.
-
HousingRental Costs Up, Mortgages Stayed FlatJanuary 29, 2026Newly Released American Community Survey compares 2020-2024 and 2015-2019 housing costs by county.
-
PopulationU.S. Population Growth Slowest Since COVID-19 PandemicJanuary 27, 2026The decline in international migration was felt across the states, though its impact varied.


