For Immediate Release: Monday, May 12, 2014
Census Bureau Reports 0.8 percent of Workers Commute by Bike in New York City
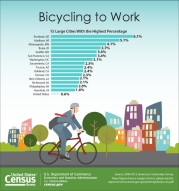
New York City had 0.8 percent of commuters bike to work, the U.S. Census Bureau reported today in a new brief focused on biking and walking to work. Nationally, 0.6 percent of workers commute by bike.
Since 2000, the percent of people who biked to work in New York, increased from 0.5 percent to 0.8 percent, according to 2008-2012 statistics from the American Community Survey. In addition, 10.3 percent of workers in New York walked to work.
"Through efforts to increase local transportation options, New York, along with many other large U.S. cities, has contributed to the increase in the number of people who bike to work," said Brian McKenzie, a Census Bureau statistician who studies commuting. "This information shapes our understanding of how people get to work and how this may change across cities in the coming years."
The report, "Modes Less Traveled — Bicycling and Walking to Work in the United States: 2008-2012," highlights the trends and socio-economic and geographic differences between motorized and nonmotorized commutes. This report — the Census Bureau's first focusing only on biking and walking to work — is one of many that examines specific aspects of commuting, including workplace location, working from home, long commutes and specific travel modes.
The American Community Survey also provides annual estimates about how commuters in New York travel to work and how long it takes them to get there.
Transportation Highlights for New York City
- Among the 3,685,786 workers in New York, 55.6 percent took public transportation, 0.8 percent biked, 10.3 percent walked, and 3.9 percent worked at home.
- Of workers who did not work from home, the average travel time to work was 39.1 minutes.
- Traveling alone by car, truck or van alone was among the most common commute modes.
View more commuting statistics for New York online: //factfinder2.census.gov/bkmk/table/1.0/en/ACS/12_5YR/S0801/1600000US3651000.
About the American Community Survey
The figures in this release come from data collected from questions in the Census Bureau's 2008-2012 American Community Survey. The questions asked include:
- How did this person usually get to work last week? If this person usually used more than one method of transportation during the trip, mark (X) the box of the one used for most of the distance.
- How many people, including this person, usually rode to work in the car, truck, or van last week?
- What time did this person usually leave home to go to work last week?
- How many minutes did it usually take this person to get from home to work last week?
Organizations use the statistics from this question to design programs that ease traffic problems, reduce congestion and promote carpooling. In addition, police and fire departments use the statistics to plan for emergency services in areas where many people work. The American Community Survey provides local statistics on a variety of topics for even the smallest communities.
Ever since Thomas Jefferson directed the first census in 1790, the census has collected detailed characteristics about our nation's people. Questions about jobs and the economy were added 20 years later under James Madison, who said such information would allow Congress to "adapt the public measures to the particular circumstances of the community," and over the decades allow America "an opportunity of marking the progress of the society."
-X-
Note: Statistics from sample surveys are subject to sampling and nonsampling error. All comparisons made in this report have been tested and found to be statistically significant at the 90 percent confidence level, unless otherwise noted. Please consult the tables for specific margins of error. For more information, go to <//www.census.gov/acs/www/data_documentation/documentation_main/>.
See <//www.census.gov/acs/www/data_documentation/2012_release/> for more information on changes affecting the 2008 — 2012 statistics. See <//www.census.gov/acs/www/guidance_for_data_users/comparing_2012/> for guidance on comparing 2008 — 2012 American Community Survey statistics with previous years.


