For Immediate Release: Thursday, September 17, 2015
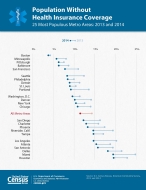
Seattle Metro Area Uninsured Rate Down from 2013
Sept. 17, 2015 —The Seattle metro area’s 2014 rate of those without health insurance decreased from 2013, according to new statistics released today from the U.S. Census Bureau’s American Community Survey, the nation’s most comprehensive data source on American households.
“Health insurance is just one of many topics included in the American Community Survey that allows policymakers at both the national and local levels to evaluate laws and policies,” Census Bureau Director John H. Thompson said.
There are more than 40 topics, in addition to health insurance, covered in the American Community Survey. The full set of 2014 social, economic, housing and demographic statistics can be found on census.gov for all 50 states, the District of Columbia, Puerto Rico, every congressional district, every metro area, and all counties and places with populations of 65,000 or more.
Highlights for the Seattle metro area include:
2014 Health Insurance
- Uninsured: 8.3 percent. This was down from 12.4 percent in 2013.
- Percentage covered by private health insurance: 74.2 percent. This was up from 72.8 percent in 2013.
- Percentage covered by public health insurance: 27.6 percent. This was up from 24.9 percent in 2013.
2014 Income
- Median household income: $71,273, up from 2013 ($68,555).
- Median earnings for male full-time, year-round workers: $61,158.
- Median earnings for female full-time, year-round workers: $46,766.
2014 Poverty
- Below poverty level: 11.3 percent of people. This was down from 12.6 percent in 2013.
- Children below poverty level: 14.4 percent in 2014. This was down from 16.9 percent in 2013.
Additional Statistics Released Today:
- Annual state-to-state migration data tables (not embargoed)
- Annual same sex data tables (national level only, not embargoed)
- Two new labor force tables in American FactFinder (Table B23026 and table B23027, embargoed)
Upcoming American Community Survey Releases
- 2010-2014 statistics for all areas regardless of size, down to the block group level: Dec. 10 (embargo begins Dec. 8).
About the American Community Survey
The American Community Survey provides a wide range of important statistics about all communities in the country. The American Community Survey gives communities the current information they need to plan investments and services. Retailers, homebuilders, police departments, and town and city planners are among the many private- and public-sector decision makers who count on these annual results. Visit the Stats in Action page to see some examples.
These statistics would not be possible without the participation of the randomly selected households in the survey.
-X-
Note: Statistics from sample surveys are subject to sampling and nonsampling error. All comparisons made in the reports have been tested and found to be statistically significant at the 90 percent confidence level, unless otherwise noted. Please consult the tables for specific margins of error. For more information, go to //www.census.gov/programs-surveys/acs/technical-documentation/code-lists.html.
Changes in survey design from year to year can affect results. See //www.census.gov/programs-surveys/acs/news/data-releases/2014.html for more information on changes affecting the 2014 statistics. See //www.census.gov/programs-surveys/acs/guidance/comparing-acs-data/2014.html for guidance on comparing 2014 American Community Survey statistics with previous years and the 2010 Census.


