The Age and Disability Paradox
The Age and Disability Paradox
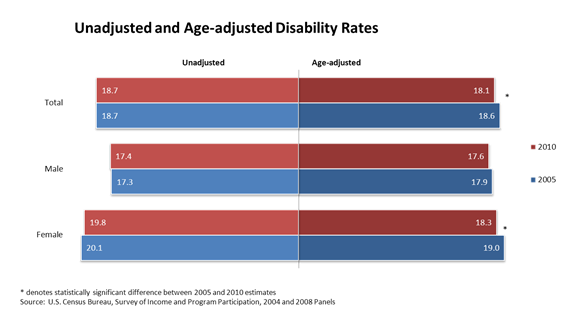
This week, the Census Bureau released the report “Americans with Disabilities: 2010,” which showed that 18.7 percent of the population has a disability. While this percentage remained unchanged from 2005 to 2010, the number of disabled people increased.
Demographically, the population is getting older, driven by the large number of baby boomers approaching retirement age; and, as you may expect, the prevalence of disability increases with age.
So how do we more accurately compare disability rates from these different years if the age distributions are so different? We can do this by a method called the “age-adjusted disability rate,” which considers what disability would look like if populations had the same age distribution. Once adjusted, we can compare disability across years to observe changes in prevalence without age as a distorting factor.
Using the age-adjusted rates, we see that disability dropped 0.5 percentage points between 2005 and 2010. Thus, removing the effect of the aging population during this time reveals that disability rates actually decreased.
Age also obscures comparisons of disability for subgroups within the population over time. For example, the age-adjusted disability rate for females dropped 0.7 percentage points in 2010, whereas the change in the unadjusted rate was not statistically significant. Among males, both the adjusted and unadjusted rates show no statistically significant difference in the prevalence of disability across the years. Thus, the change in age-adjusted disability rates appears to be driven by a drop in disability among women.
Age adjustment also helps in making comparisons across race or ethnic groups that have different age structures. For example, the 2010 Census showed that the median age was 42.0 years for non-Hispanic whites and 27.3 years for Hispanics. The much younger Hispanic population had an overall disability rate much lower than that of non-Hispanic whites (13.2 compared with 19.8 percent). However, after standardizing the two populations’ age structure, the adjusted disability rates for non-Hispanic whites and for Hispanics were not statistically different.


