Using Administrative Data to Evaluate Nonresponse Bias in the 2026 Current Population Survey Annual Social and Economic Supplement
Using Administrative Data to Evaluate Nonresponse Bias in the 2026 Current Population Survey Annual Social and Economic Supplement
Estimated reading time: 4 minutes
In the latest release of its annual income report, Income in the United States: 2025, the U.S. Census Bureau tabulates the national income distribution using survey responses collected as part of the 2026 Current Population Survey Annual Social and Economic Supplement (CPS ASEC). However, as Research Matters blog posts from each of the last six years have explained (in 2020, 2021, 2022, 2023, 2024, and 2025), nonresponse in the CPS ASEC has biased income and poverty estimates.1 Nonresponse bias means that differences between those who respond to a survey and those who do not respond lead to an estimate that is less representative of the population.
Trends in CPS ASEC Response Rates
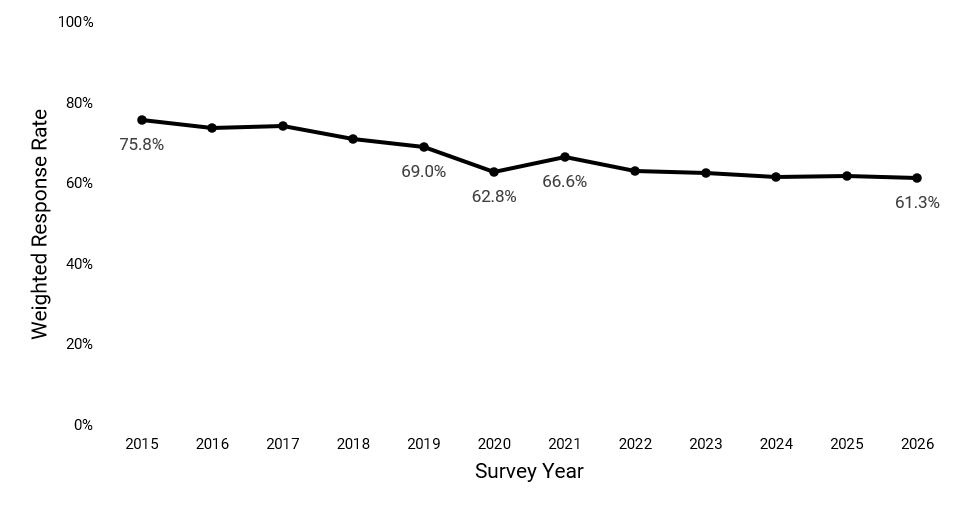
Figure 1 plots weighted CPS ASEC response rates for 2015 through 2026. The weighted response rate for the 2026 CPS ASEC was 61.3%, compared to 62.8% in the 2020 CPS ASEC.
Figure 1. Weighted Response Rates in the Current Population Survey Annual Social and Economic Supplement: 2015 to 2026
Source: U.S. Census Bureau, Current Population Survey, March 2026 Annual Social and Economic Supplement Technical Documentation.
Lower response rates are not necessarily problematic if respondents and nonrespondents are similar, such that the resulting sample of respondents remains representative of the nation. To investigate this possibility, we combined administrative records, 2010 Census data, and American Community Survey responses to determine whether households that did and did not respond to the CPS ASEC systematically differed, and whether these differences biased the resulting income and poverty estimates.
Comparing Respondents and Nonrespondents with Administrative Records
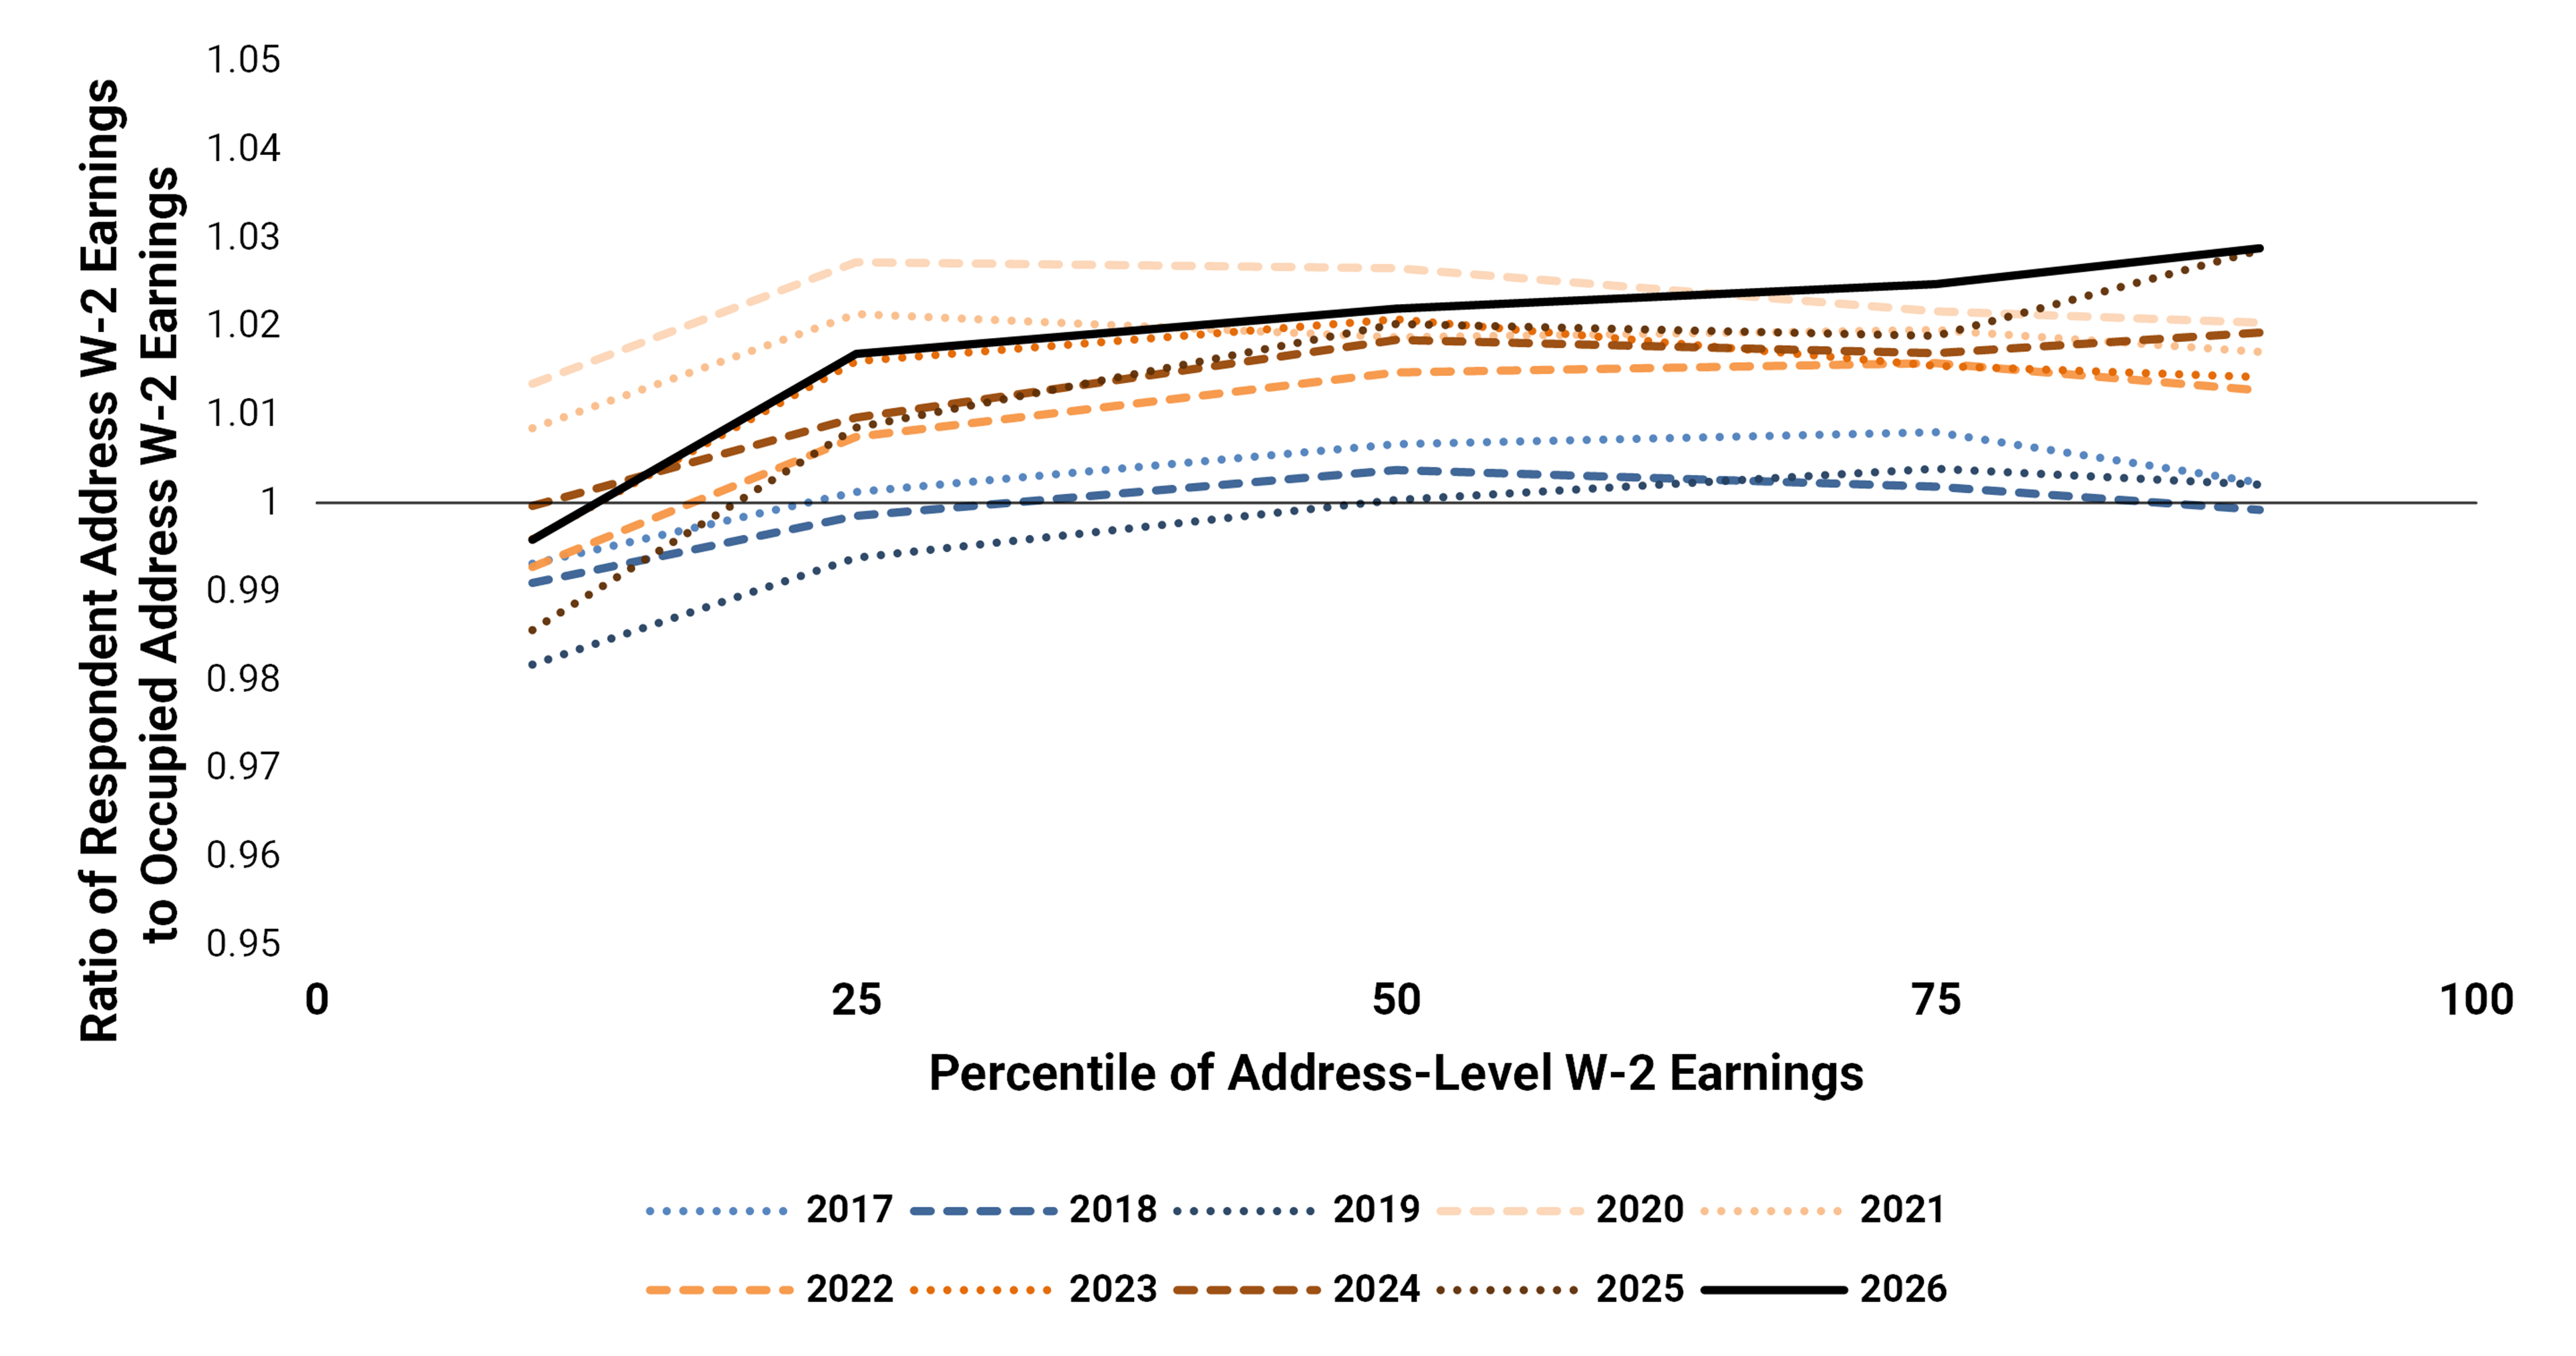
Figure 2 plots earnings ratios between survey respondents and the full sample of occupied addresses (including nonrespondents) using IRS Form W-2 records linked by address. It shows that in 2020 respondents began to have higher earnings than the population as a whole, whereas in earlier years the gap had been narrower.2,3 The phenomenon of respondents skewing toward higher earners has repeated every year since 2020. Specifically, in each year from 2020 to 2026, the ratio of respondents’ median earnings to those of the full sample was significantly larger than the ratio in each of the years 2017 to 2019.4
Figure 2. Earnings Ratios Between Respondents and the Full Sample of Occupied Addresses
Source: U.S. Census Bureau, Current Population Survey, 2017 to 2026 Annual Social and Economic Supplements (CPS ASEC) linked to IRS Form W-2 earnings data by address.
This divergence between respondents and nonrespondents has biased the resulting income statistics. We measure this bias by estimating a nonresponse adjustment that leverages information from linked data sources not available in standard survey processing.5
Impact of Nonresponse Bias on Income and Poverty Estimates
Using the weights created from this nonresponse adjustment, we calculate alternative income and poverty statistics and compare them to the official (survey-only) estimates. We find that, in 2017, 2018, and 2019, estimates of median household income and poverty rates were not statistically different from the nonresponse-adjusted estimates. This indicates that in pre-pandemic years the normal nonresponse adjustment in the survey weights sufficiently addressed nonresponse bias for these statistics.
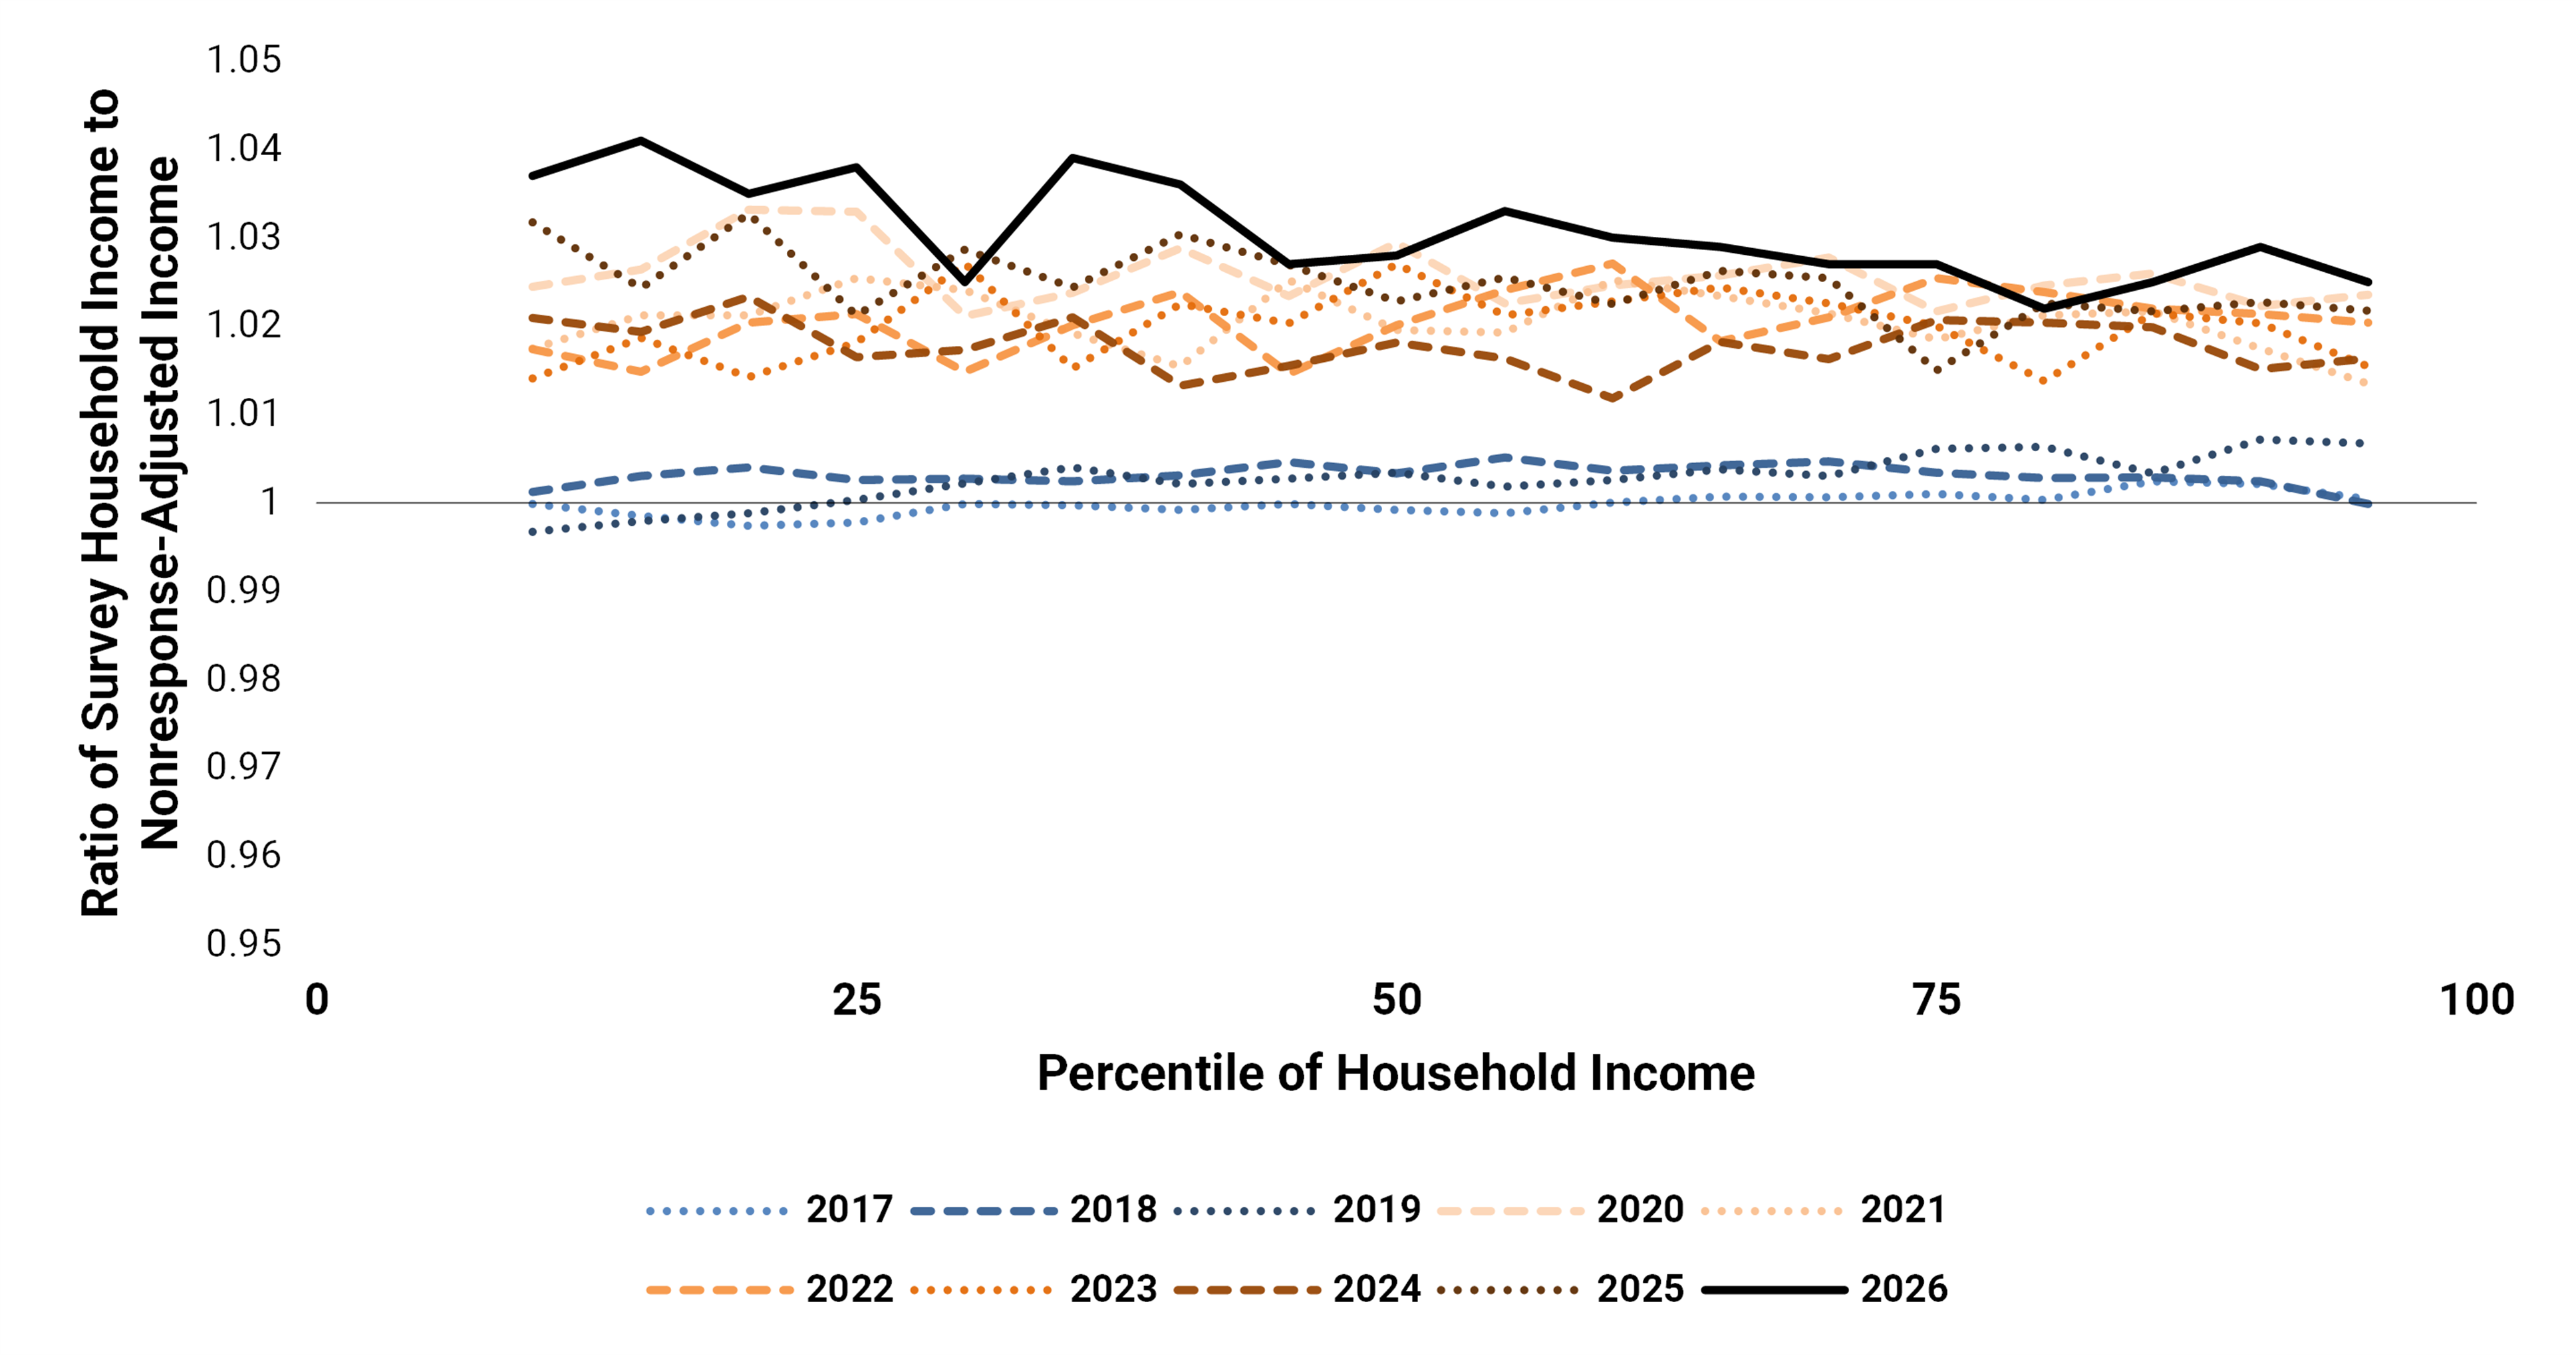
However, Figure 3 shows that since 2020 the survey-only income estimates have diverged from the nonresponse-adjusted estimates. Figure 3 plots the ratios of the survey-only estimates to the nonresponse-adjusted estimates across the household income distribution. Before 2020, these ratios hovered near 1, but since 2020 the survey-only income estimates have been about 2% to 4% higher than the alternative estimates, indicating upward bias.6 This year the bias at the median was 2.8%.
Figure 3. Comparison of Survey-Only Income to Nonresponse-Adjusted Income
Source: U.S. Census Bureau, Current Population Survey, 2017 to 2026 Annual Social and Economic Supplements (CPS ASEC) linked to data from the American Community Survey; SSA Numident; 2010 Census; IRS Information Return Master File; and IRS Forms 1099-R, W-2, and 1040.
We also estimate alternative nonresponse-adjusted poverty rates among all families. In the 2026 survey, the poverty rate was statistically significantly lower than those yielded by alternative weights, by 0.6 percentage points. This difference was not statistically different from any of the differences for 2020 to 2025, which ranged from 0.3 to 0.5 percentage points.7
To summarize: although response rates have continued to drop since the 2020 survey, nonresponse has steadily continued to bias income statistics upward by 2% to 4% and official poverty rates downward by a fraction of a percentage point. Because the bias has remained relatively stable since 2020, estimates of year-to-year changes in income and poverty estimates have not been significantly biased except for the 2019-2020 comparison.
This work is part of a larger research agenda at the Census Bureau to develop and apply new methods to improve data quality. For example, the National Experimental Well-Being Statistics (NEWS) uses additional data from administrative and commercial sources, along with improved weighting and machine learning, to produce the best possible estimates of income and poverty. Whether or not current trends in response rates continue, this research promises to address well-known challenges with our surveys and advance the Census Bureau’s commitment to serve as the country’s leading provider of quality data about its people and economy.
Definitions and information on confidentiality protection, sampling error, and nonsampling error are available at the March 2026 Annual Social and Economic Supplement Technical Documentation.
1 More information about the design of the survey, including weighting for nonresponse, is available in Technical Paper 77 and in a summary of weighting in the CPS.
2 We refer to survey years in the text, tables, and figures to keep the references consistent and more clearly identify the 2020 to 2026 CPS ASEC surveys as the ones more affected by nonresponse bias. These surveys ask about income received in the previous year, however. Statistics from the 2020 CPS ASEC, for example, describe income received during 2019.
3 We use the full sample of occupied addresses for comparison to respondents because the set of occupied addresses is representative of the target U.S. population. In the absence of survey nonresponse, statistics for respondents would equal statistics for the full sample of occupied addresses. The set of occupied addresses differs from the original survey contact frame in that it excludes addresses that field representatives have verified to be ineligible or out of scope, such as units that are vacant, demolished, converted to a business, under construction, etc. A statistically significant difference between respondents and the full set of occupied addresses is mathematically equivalent to a statistically significant difference between respondents and nonrespondents. All comparative statements have undergone statistical testing and are statistically significant at the 10% significance level unless otherwise noted.
4 Because administrative records for 2025 were unavailable, the nonresponse adjustment method for 2026 is based on records for 2024 rather than 2025. The method is otherwise unchanged for 2026. When similar methods were applied to the 2024 and 2025 estimates, the magnitudes of the measured nonresponse biases were not meaningfully different.
5 For methodological details, refer to Rothbaum and Bee (2021). One important limitation is that alternative weights can only adjust for differences that can be observed in the linked data. To the extent that respondents and nonrespondents differ in ways those data do not capture, some bias may remain. We therefore interpret the nonresponse-adjusted estimates as a well-grounded benchmark for evaluating bias, not as a definitive measure of the truth.
6 Specifically, since 2020, survey-only income estimates have been statistically significantly greater than the nonresponse-adjusted income estimates at all percentiles except for the 10th percentile in 2022 and 2023 and the 95th percentile in 2021.
7 The differences between the survey and alternative nonresponse-adjusted poverty rates in 2020, 2021, 2022, 2023, 2024, 2025, and 2026 are each statistically significant, but the differences among those differences are not statistically significant.