For Immediate Release: Wednesday, May 18, 2022
Per Pupil Spending Continues to Increase in 2020
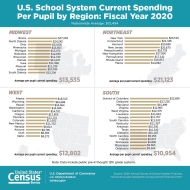
May 18, 2022 – Per pupil spending increased in fiscal year 2020 for the ninth year in a row, up to $13,494 in FY 2020 from $13,187 in FY 2019, a 2.3% increase from the previous year. This increase is the smallest since 2013, according to the latest figures from the 2020 Annual Survey of School System Finances. Figures from this report include data from the start of the COVID-19 pandemic.
Additionally, school districts on the east coast had the highest rates of per pupil spending in FY 2020. Data from the Annual Survey of School System Finances provide insight into public school spending per pupil (pre-K through 12th grade), as well as revenue and other school system spending details for all states and the District of Columbia. With the exception of school systems in Alabama, the District of Columbia, Nebraska, Texas, and Washington, the 2020 fiscal year for school systems in all states began on July 1, 2019, and ended on June 30, 2020. The fiscal year for school systems in Alabama and the District of Columbia ran from October 1, 2019, through September 30, 2020. The fiscal year for school systems in Nebraska, Texas, and Washington ran from September 1, 2019, through August 31, 2020. Survey data are not adjusted to conform school systems to a uniform fiscal year. Additional information about the fiscal year time periods is available here.
At the district level, the New York City School District in New York spent the most per pupil ($28,828) out of the nation’s 100 largest school systems (by enrollment) in FY 2020. Other east coast school districts also led in per pupil spending in 2020:
- Boston City School District in Massachusetts ($27,793)
- District of Columbia Public Schools ($22,856)
- Atlanta School District in Georgia ($17,289)
In FY 2020, the largest portion of public elementary-secondary per pupil spending went toward instructional salaries, which totaled $247.0 billion or 31.8% of total expenditures.
Other highlights:
- The five states that spent the most per pupil in FY 2020 were New York ($25,520), the District of Columbia ($22,856), which comprises a single urban district, Connecticut ($21,346), Vermont ($20,838), and New Jersey ($20,670).
- Public elementary-secondary school systems spent a total of $776.4 billion in FY 2020, up 3.2% from $752.3 billion in FY 2019.
- Of the total expenditure for elementary and secondary education, current spending accounted for $667.9 billion (86.0%) and capital outlay for $84.0 billion (10.8%) in FY 2020.
- Elementary and secondary education revenue from all sources in FY 2020 totaled $771.1 billion, up 2.6% from $751.7 billion the previous year.
- State governments contributed the greatest share – $362.4 billion or 47.0% – of public school system funding in FY 2020.
- Public school systems in Alaska (14.6%), New Mexico (13.9%), South Dakota (13.9%), Mississippi (13.3%), and Montana (12.4%) received the highest percentage of their revenues from the federal government, while public school systems in New Jersey (3.7%), Connecticut (3.9%), New York (4.3%), Massachusetts (4.5%), and New Hampshire (4.7%) received the lowest.
Education finance data include revenues, expenditures, debt and assets (cash and security holdings). Statistics are not adjusted for cost-of-living differences between geographic areas.
A preliminary version of the FY 2021 data is set to be released in the fall of 2022.
No news release associated with this product. Tip sheet only.
###


