
Business Dynamics Statistics of Single Unit Firms with Revenue (BDS-SU-REV)
The Business Dynamics Statistics of Single Unit Firms with Revenue (BDS-SU-REV) is an experimental data product extending the set of statistics published by the Business Dynamics Statistics (BDS) program. The BDS-SU-REV provides year-over-year changes in employment, payroll, and revenue for each quarter of the year for businesses that operate in one location (single-units) and file their taxes under a single Employer Identification Number (EIN). This product relies on IRS annual tax filings to collect revenue information and IRS quarterly tax filings to collect employment and payroll information for the pay periods including March 12th, June 12th, September 12th, and December 12th. Year-over-year employment and payroll changes are calculated between the same point in year t and year t-1 (i.e., June 12th year t-1 to June 12th year t, etc.). Employment and payroll growth is labeled as job and pay creation respectively and employment and payroll decline as job and pay destruction.
A novel innovation in the BDS-SU-REV is the incorporation of annual revenue data for single-establishment firms that consistently maintain positive employment levels each quarter. A positive annual growth in revenue is categorized as revenue creation, while negative growth is categorized as revenue destruction.
Jump to:
Revenue Data Insights
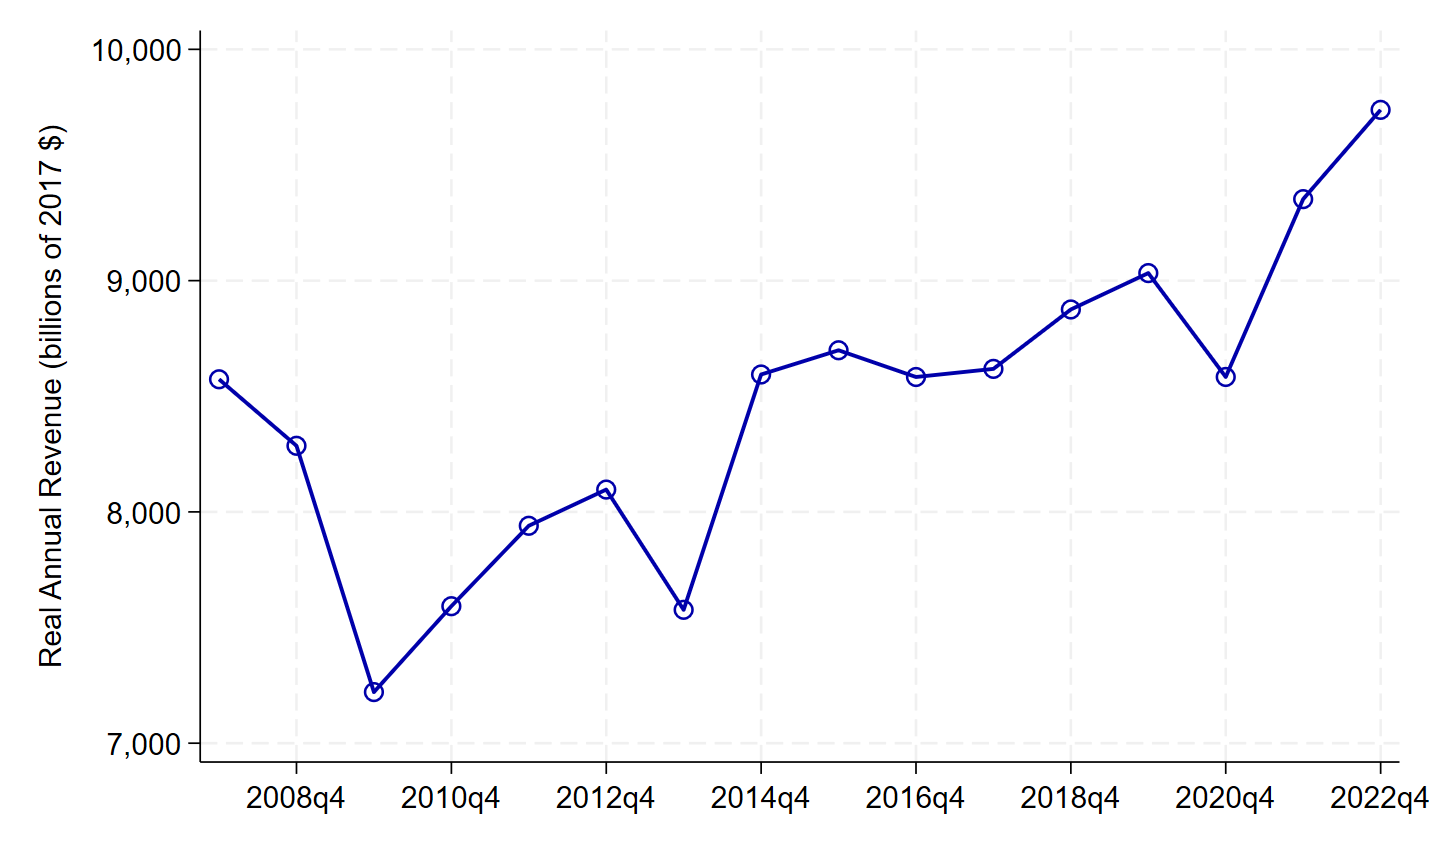
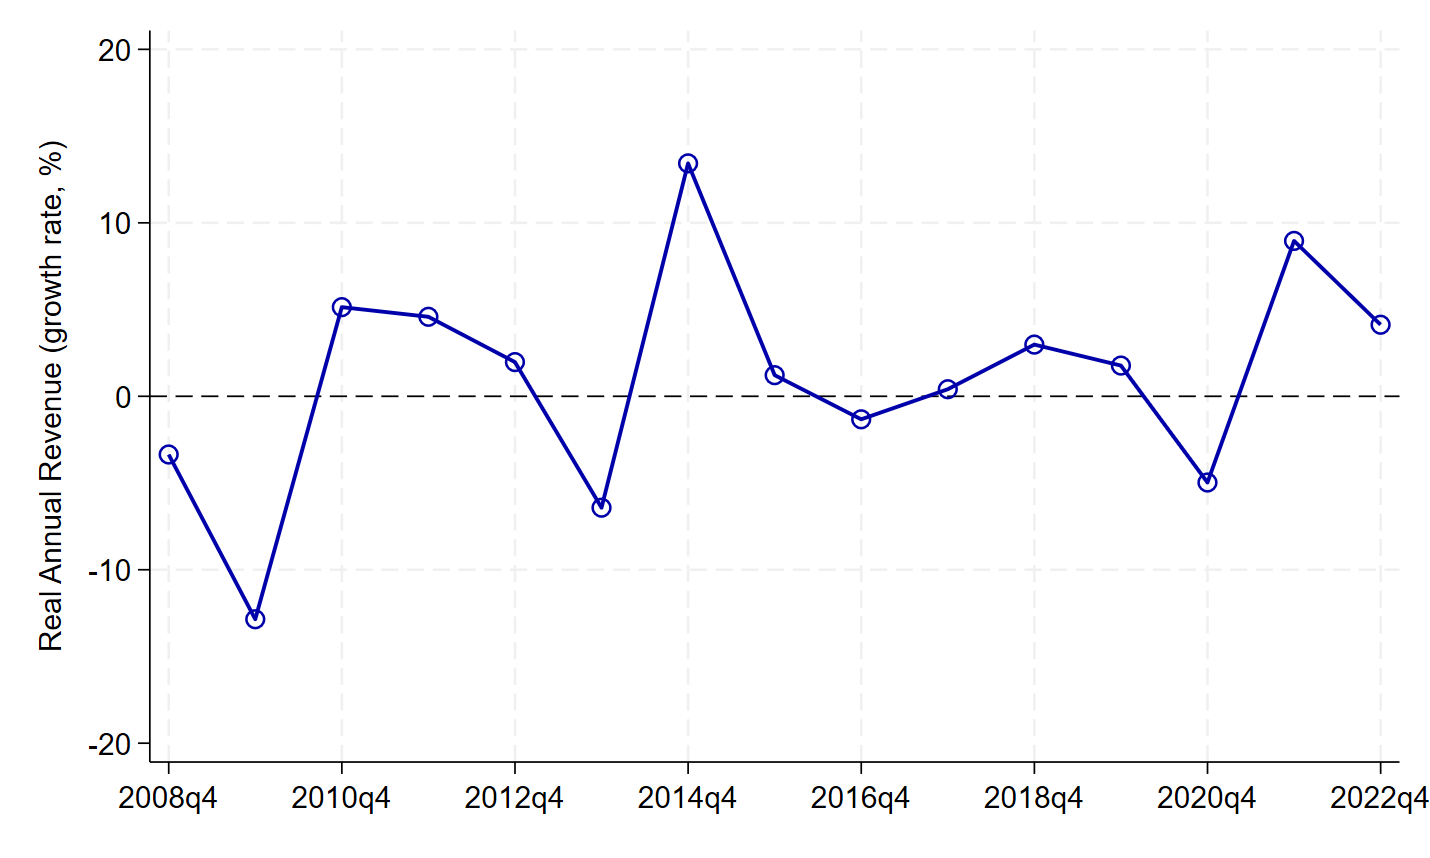
With this release of the BDS-Single Unit Firms with Revenue experimental product (vintage 2023), we extend the time series of revenue data back in time, so it begins in the same year (2007) as the payroll and employment time series. In Figure 1(a), we show real annual revenue over time for single-unit firms that operated in the 4th quarter of each year. Real revenue has generally increased over time as the economy has grown, with notable dips in 2009 during the Great Recession and 2020 during the COVID-19 Pandemic. In Figure 1(b), we show the annual growth rate for real revenue. The years 2010 and 2021 recorded strong growth as the economy recovered, while in 2011 and 2022 the economy grew more slowly. There was also a drop in revenue in 2013 although the causes of this are less clear. It could be related to unknown underlying data issues, the government shutdown that year, or some other cause.
Figure 1. Real annual revenue over time
(a) Levels
(b) Annual growth rate
In Figure 2, we show the share of annual revenue by NAICS industry sector for 2007 and 2022.1 In 2007, almost 50% of revenue generated by single-unit firms is in the Construction, Wholesale Trade, or Retail Trade sectors. Healthcare, Manufacturing, and Professional, Scientific, and Technical Services account for another 25% of revenue, and the remaining 13 sectors account for the last 25% of revenue. These shares shifted by 2022 with the top three sectors shrinking and the All Other Sectors category growing. All Other Sectors grew to account for almost 30% of revenue while Construction, Wholesale Trade, and Retail Trade decreased to approximately 46% of revenue. Professional, Scientific, and Technical Services made up a larger share of revenue in 2022 compared to 2007 (7.5% compared to 8.7%) while Manufacturing made up a smaller share (10.2% compared to 8.5%), as did Health Care and Social Assistance (7.3% compared to 6.9%). This latter finding is consistent with published data from the 2007 and 2022 Economic Censuses showing a declining share of revenue for single-unit firms in the Health Care and Social Assistance sector.2 While revenue for this sector grew overall during this time period, multi-unit-firm revenue grew more rapidly and health care shrank as a share of overall single-unit revenue.
1 Each firm is assigned an industry classification using the 2017 vintage of NAICS.
2 From Economic Census table EC0762SSSZ3 Share of revenue in sector 62 generated by single-unit firms in 2007 was 35.5%. From Economic Census table EC2200SIZESUMU Share of revenue in sector 62 generated by single-unit firms in 2022 was 27.0%.
Figure 2. Real annual revenue by sector
(a) 2007

(b) 2022

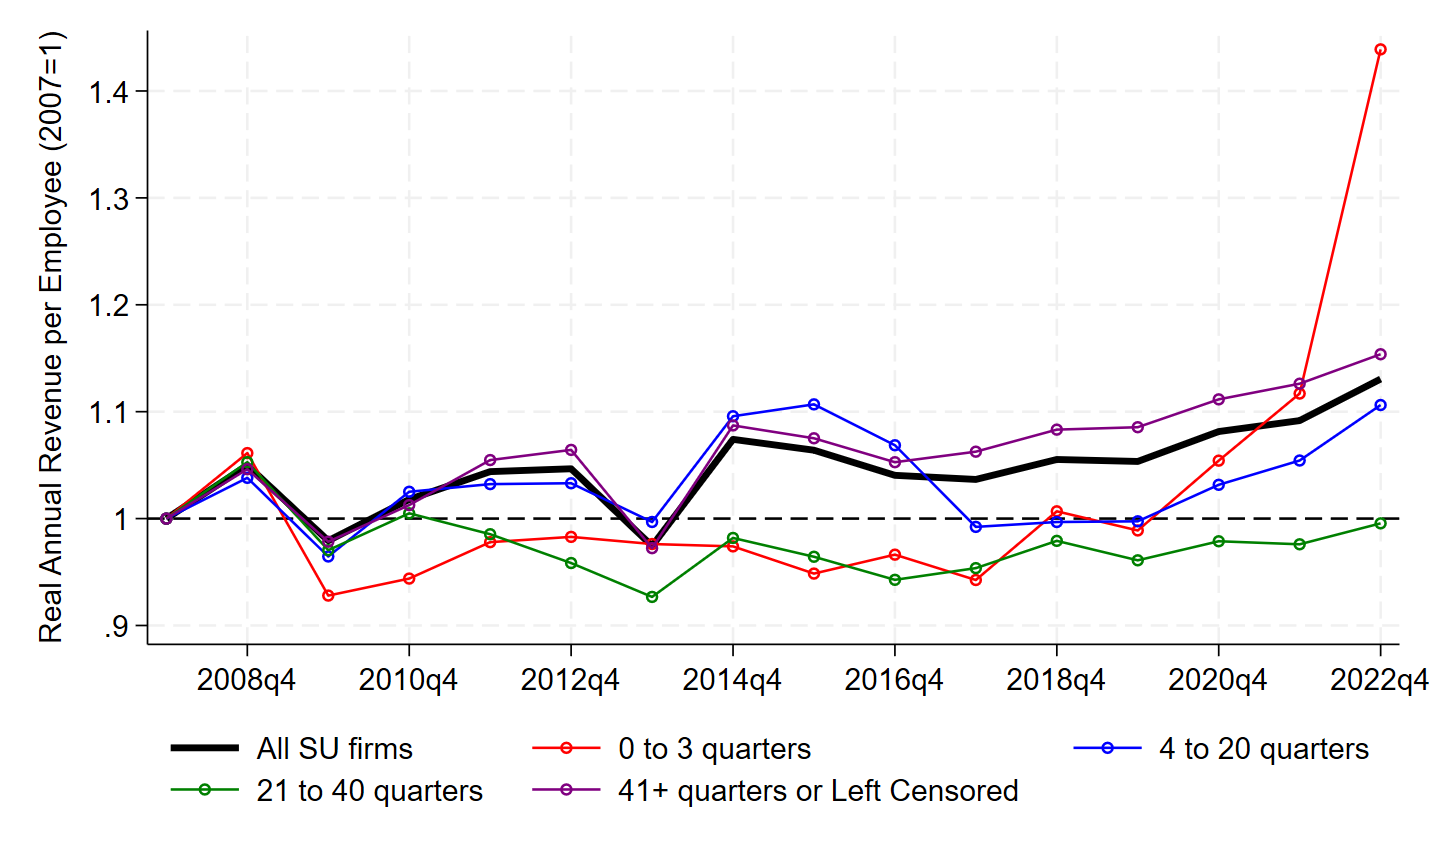
In Figure 3, we show real annual revenue per worker, benchmarked to 2007. We divide single-unit firms into four age categories: 0-3 quarters (less than 1 year), 4-20 quarters (1-5 years), 21-40 quarters (6-10 years), and more than 40 quarters or left censored (10+ years). Age is calculated as number of quarters since the first quarter of positive employment. Left censored firms are those that were already in operation in 1976 when the underlying microdata begins. The time trends are relatively stable for the different age groups, except for the youngest firms. For start-ups in 2022, significantly more revenue was generated per worker hired than for start-ups in previous years. From the core BDS we know that 2022 was a high point for the number of start-ups, up almost 15% compared to 2020. From these data on single-unit firms we learn that 2022 single-unit start-ups were highly productive.
Figure 3. Real annual revenue per employee over time, by firm age
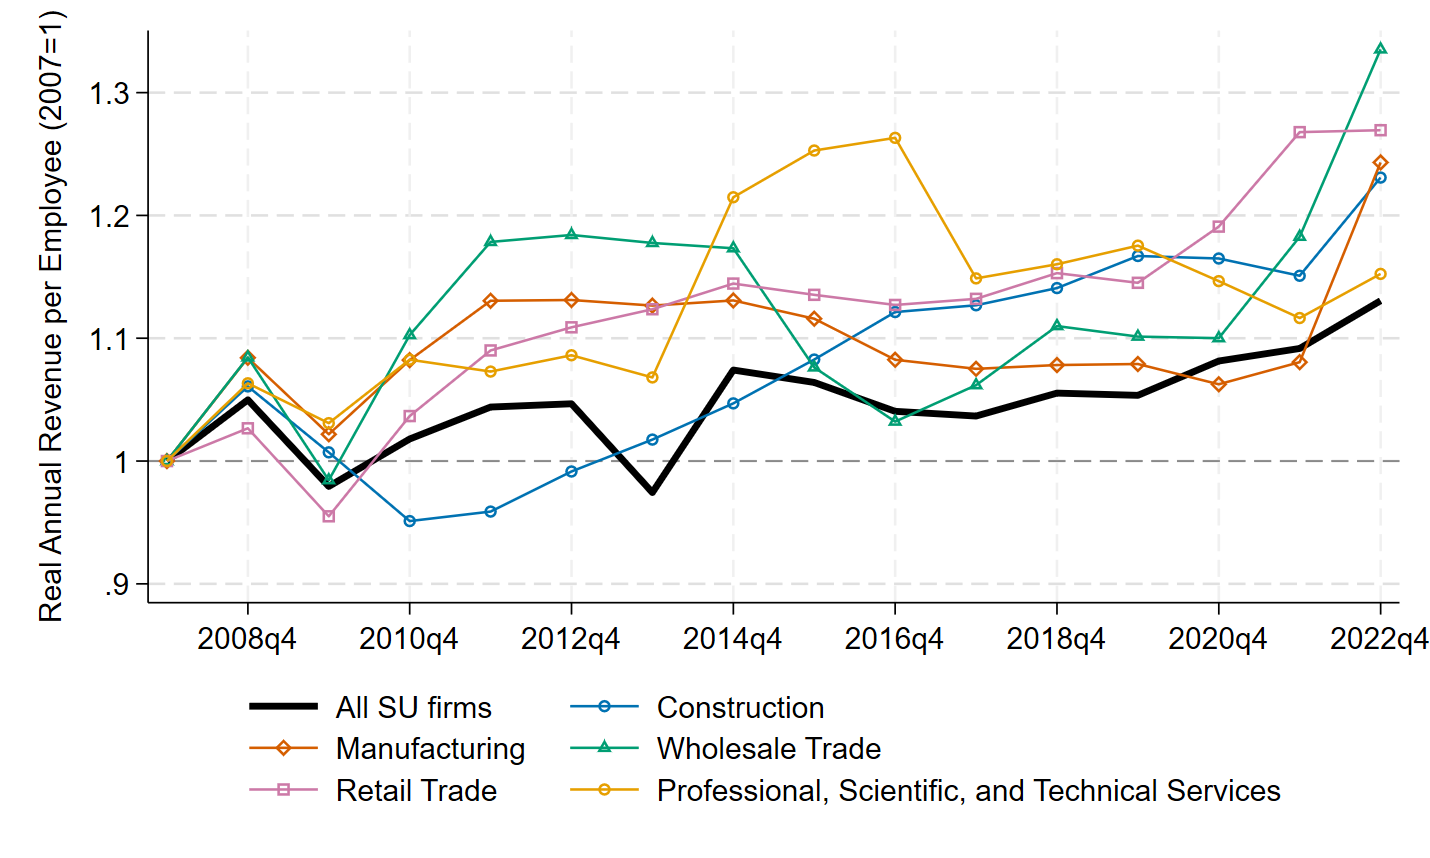
In Figure 4, we show annual revenue per worker by sector, again benchmarked to 2007. For comparison, the black, bold line represents the annual revenue per worker for all single unit firms. The five sectors we show all experienced a rise at the end of the time series, generating more revenue per worker in 2022 than in 2021. Construction shows a long-run rise between the Great Recession and 2022. Wholesale Trade, in contrast, declined after 2014 before increasing again in 2021 and 2022. Manufacturing was relatively stable until a large increase in 2022.
Figure 4. Real annual revenue per employee, by sector
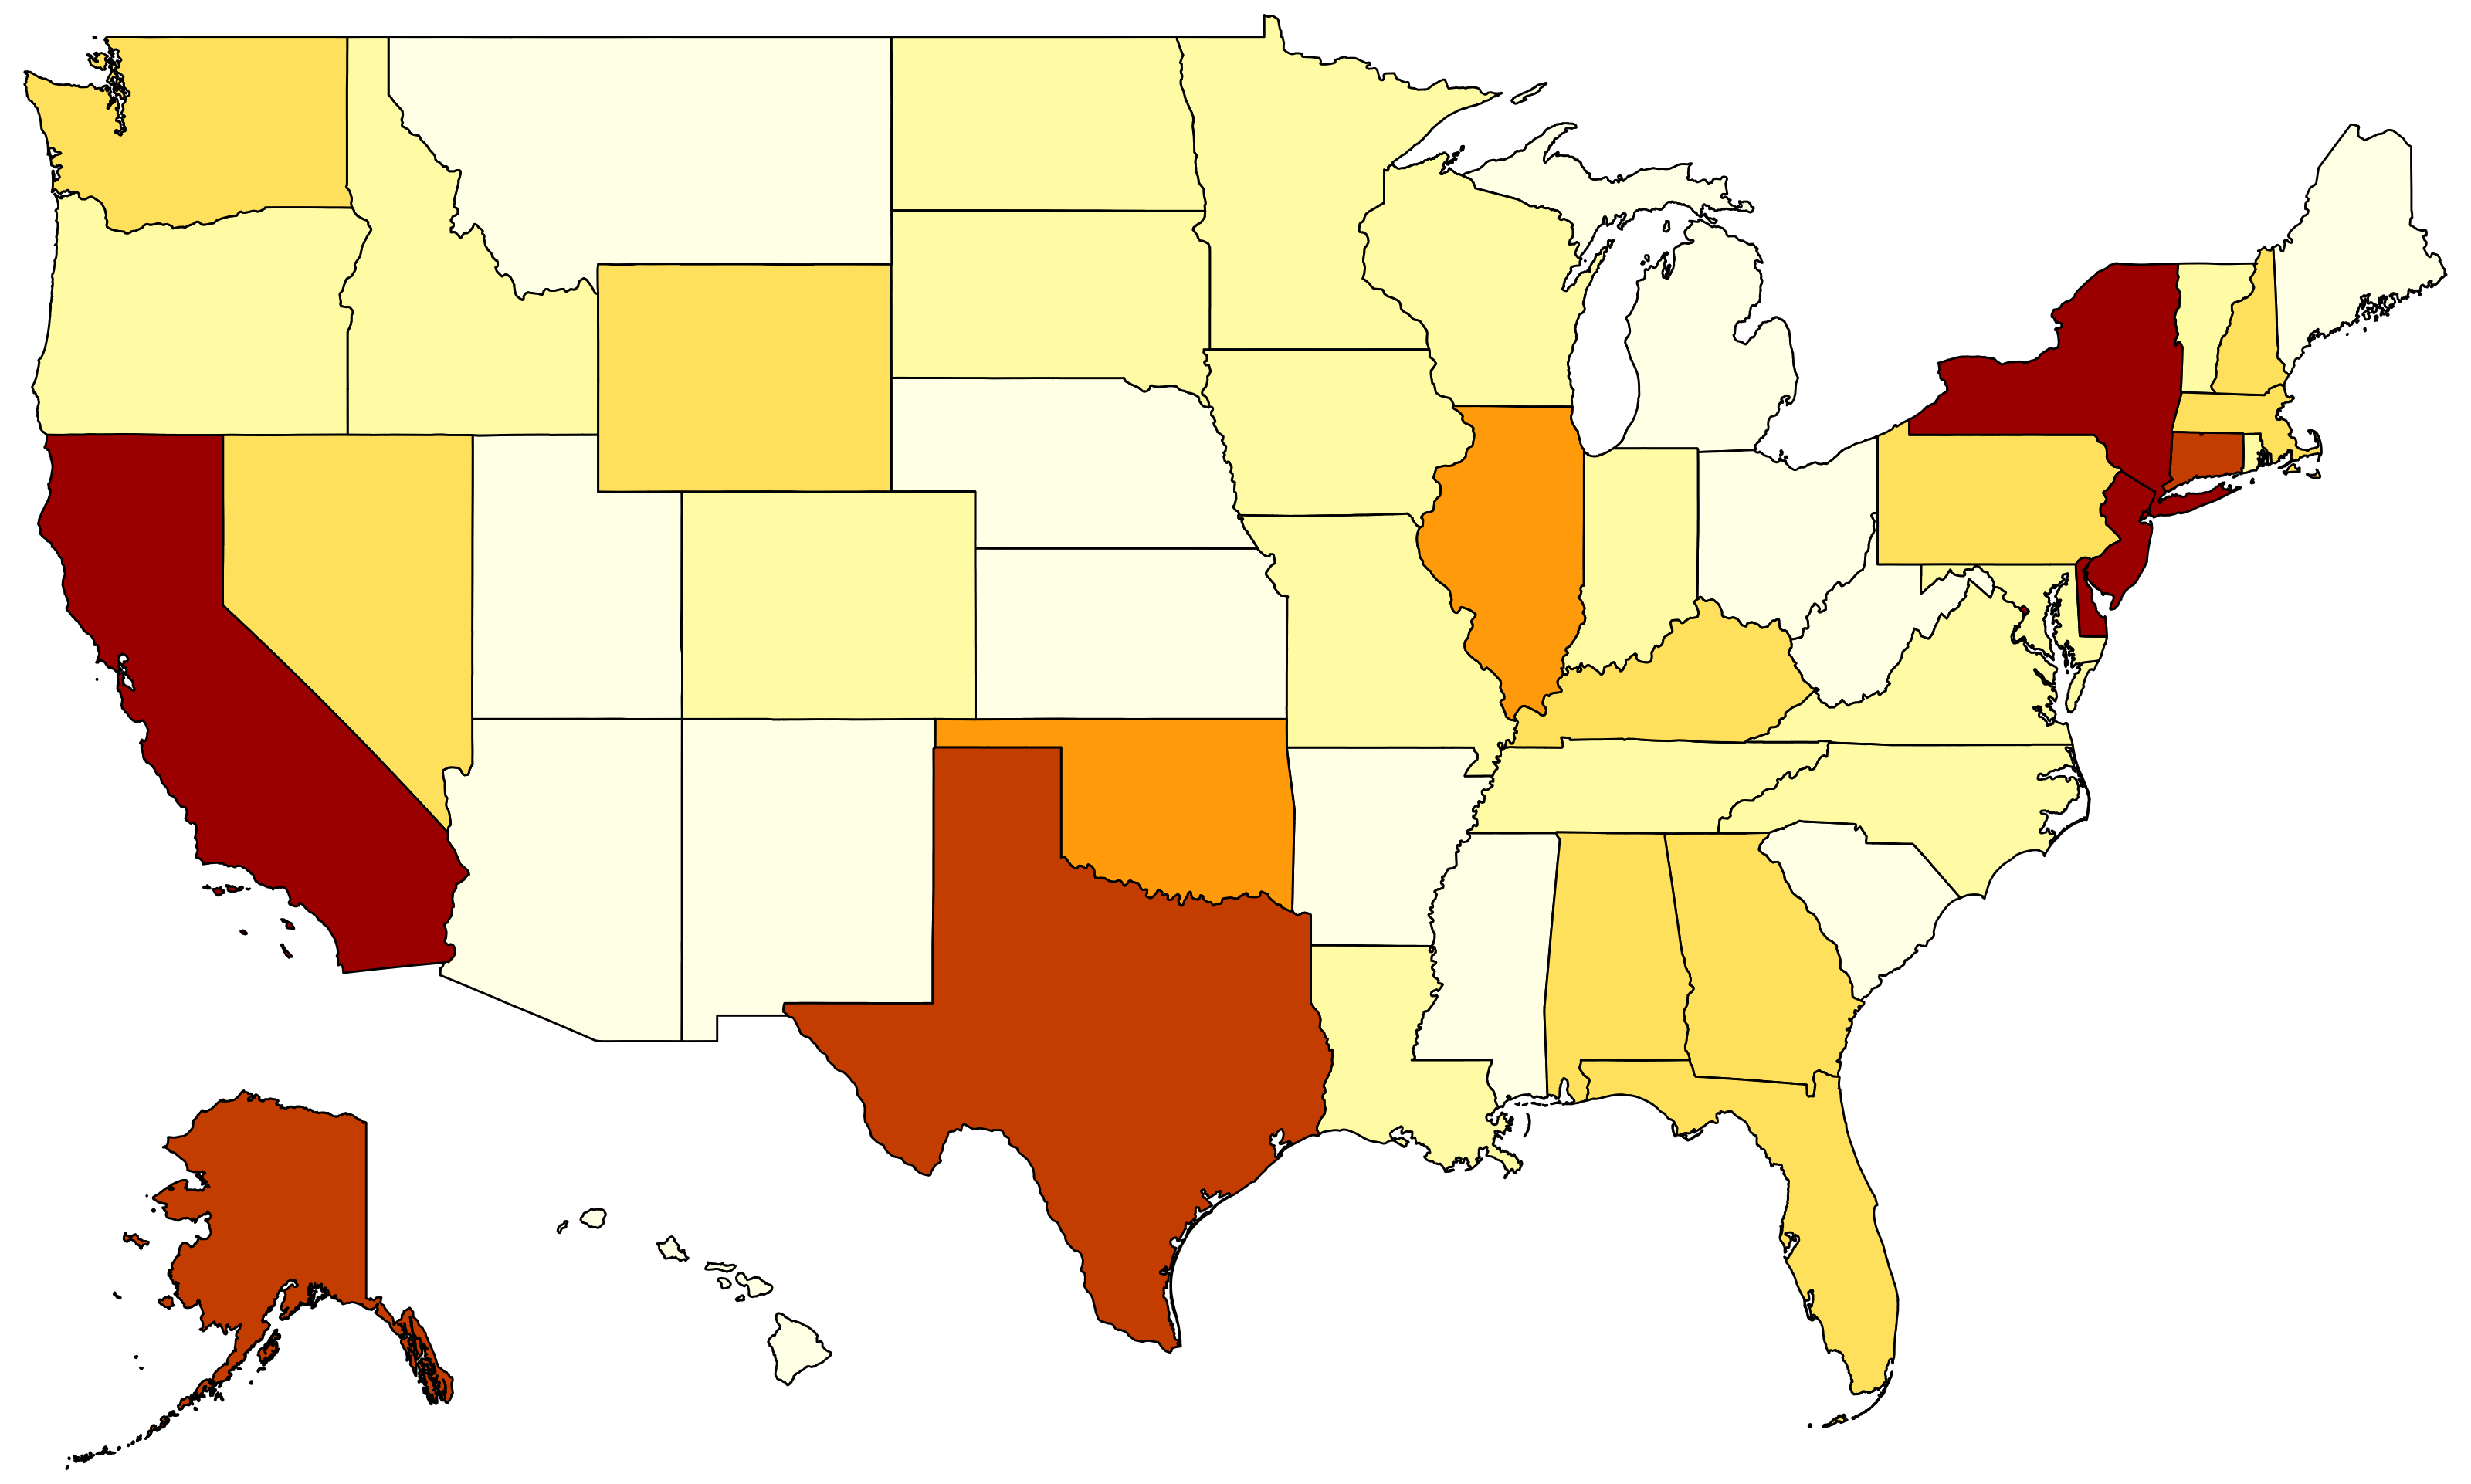
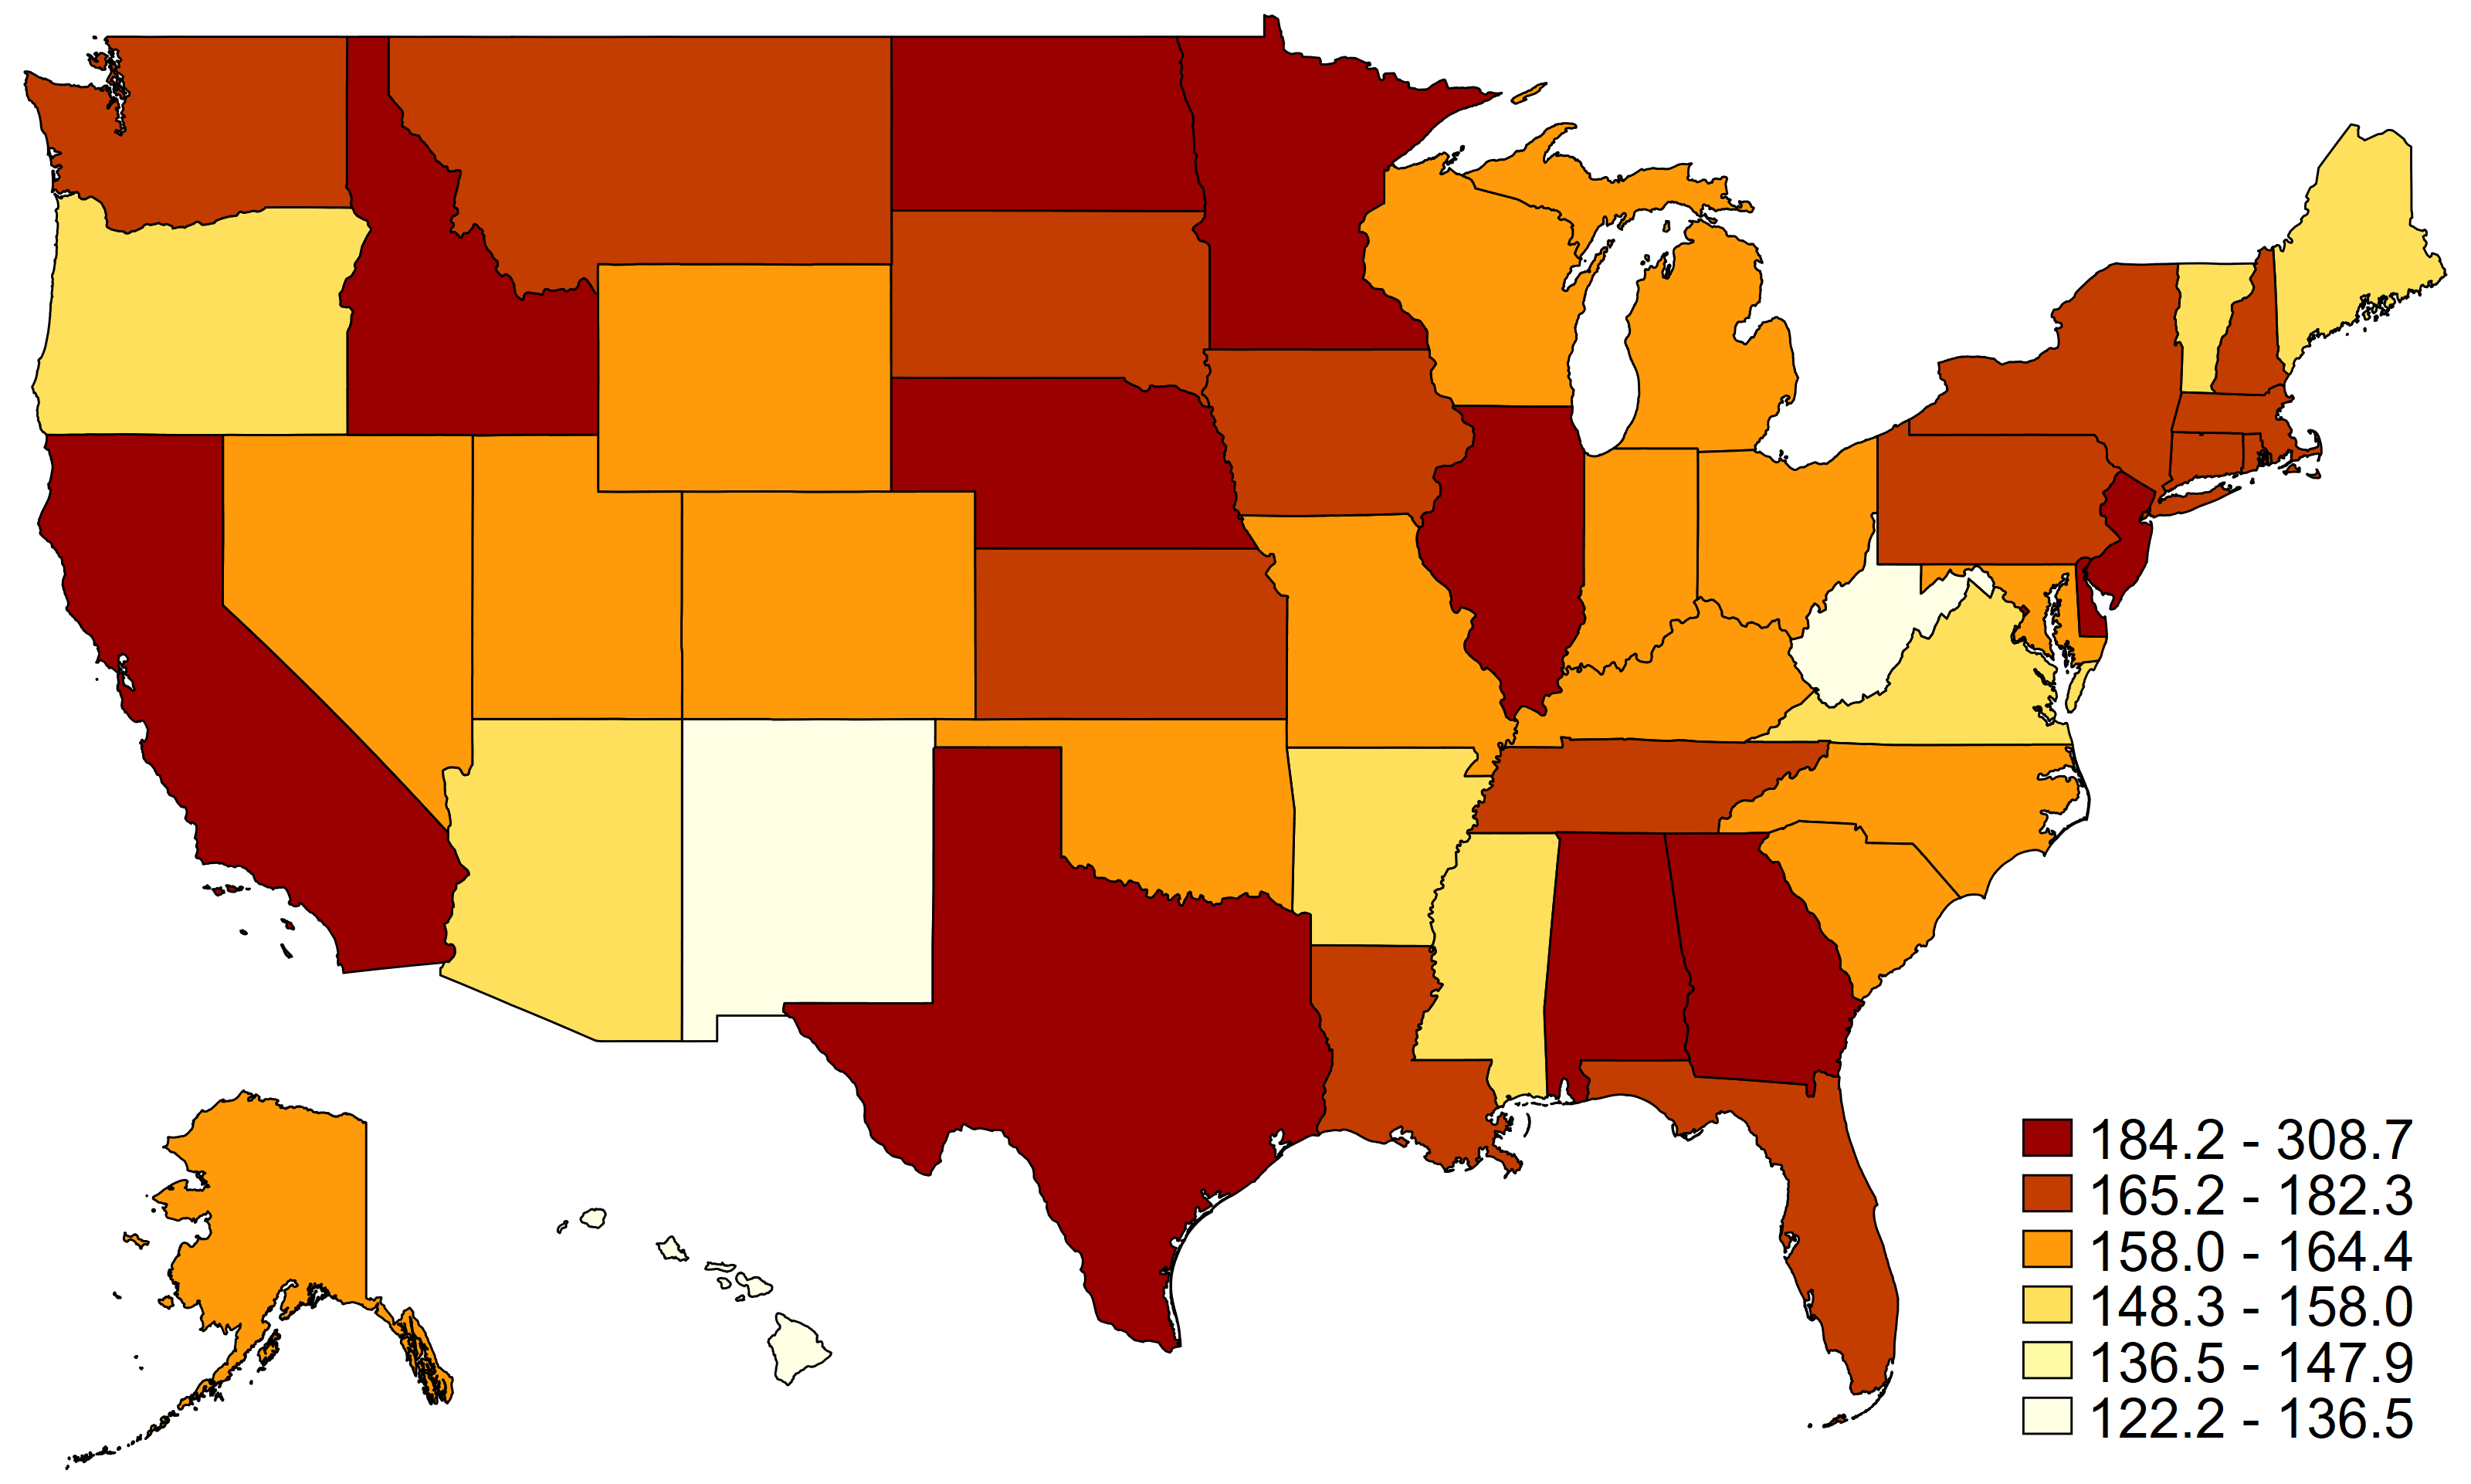
Finally, in Figure 5 we show real annual revenue per worker by state for 2007 and 2022. Darker colors represent higher ratios of revenue per worker. Almost all states had higher revenue per worker in 2022 compared to 2007 but the relative rankings of the states changed over time. In 2007, the states with the highest revenue per worker were California, Texas, Oklahoma, Illinois, New Jersey, New York, and Connecticut. By 2022, the upper Midwest experienced a significant increase in revenue per worker with North Dakota, Nebraska, and Minnesota all rising to the highest category, surpassing New York and Connecticut. Idaho, Illinois, Georgia, and Alabama also joined the highest category. Montana, South Dakota, Kansas, and Iowa all increased their revenue per worker more than states such as Virginia, North Carolina, Colorado, or Oregon.
Figure 5. Real revenue per employee by state
(a) 2007
(b) 2022
Summary of Published Data
The BDS-SU-REV provides quarterly statistics from 2007 Q1 to 2023 Q4. There are 46 tables, each expressed in nominal and real terms. Tables are stratified by year, quarter, and firm characteristics and contain the following information:
- Total number of firms
- Total employment, payroll, and revenue
- Number of firms opening and closing
- Jobs, payroll, and revenue created by continuing firms and new firms
- Jobs, payroll, and revenue destroyed by continuing firms and closing firms
- Net job creation, payroll creation, and revenue creation
- Payroll per employee for continuing, new, and exiting firms
- Revenue per employee for continuing, new, and exiting firms
Tables are stratified by the following characteristics or some combination thereof. In addition, there is an economy-wide table stratified only by year and quarter:
- Firm age – number of calendar quarters since the first quarter of positive payroll (six detailed categories and five coarse categories)
- Firm size – employment count (five detailed categories and three coarse categories)
- NAICS sector
- NAICS 3-digit industry
- NAICS 4-digit industry
- State
- Metro/non-metro indicator
- Rural/urban continuum – based on percentage of the county that is urban (four categories)
- MSA - Metropolitan Statistical Area (metro areas reported individually, micro areas summed)
- County
Key Innovations
Unlike the main BDS, which measures firm age in years, the BDS-SU-REV measures firm age in quarters. These quarterly single-unit data have numerous advantages. First, because these businesses operate in a single place, the firm, as defined by ownership, is equivalent to the establishment, as defined by location. This simplifies the reporting of business characteristics since age and size are the same for the firm as for the establishment. Second, because the quarterly data allow us to identify the first and last quarters a business had employees, we can date business entry and exit more precisely during the year. Third, the quarterly data also capture large temporary disruptions to the economy that happen in a single year, such as the 2020 COVID-19 pandemic recession or a natural disaster, which would be missed in the traditional BDS annual March-over-March job change estimates. Finally, the quarterly data include payroll, allowing us to calculate payroll creation and destruction in an analogous manner to employment.
While the quarterly employment time series begins in 2007, quarterly payroll data exist back to 1976, allowing us to measure firm age over the same time span as the main BDS. We identify the first quarter a firm had payroll between 1976 Q1 and 2023 Q4 and then measure firm age as the number of calendar quarters between the first and current quarter. In comparison, the main BDS identifies the first year a firm had employment in the pay period that includes March 12th and then calculates firm age as the number of calendar years between the first and current year. If a firm began in the 2nd, 3rd, or 4th quarters of the year, its birth will not be recognized by the main BDS until the following year in March. This annual measurement aggregates births over all the quarters of the prior year and reports them at the end of the 1st quarter each year. The quarterly measurement of the BDS-SU-REV disaggregates these births across the four quarters of the year. The same is true for firm exits.
Another innovation of the BDS-SU-REV product is the addition of payroll and revenue measures that mirror the employment measures. These new measures include total payroll, total revenue, payroll creation (year-over-year increase), revenue creation, payroll destruction (year-over-year decrease), revenue destruction, net payroll creation (total creation minus total destruction), net revenue creation, and the portion of payroll and revenue creation attributed to new businesses ('births') and the portion of payroll and revenue destruction attributed to business closures ('deaths').
Note that while the payroll and employment variables are measured at the quarterly level, revenue is only measured annually. However, all revenue measures are presented at the quarterly level, reflecting the annual revenue generated by businesses active in that quarter. For more information, please refer to the BDS-SU-REV definition.
Finally, we publish the ratio of payroll to employment and revenue to employment for all single-unit firms, and separately for continuing, entering, and exiting firms. Comparing this ratio for different groups of firms provides information about how average pay per worker and revenue per worker (labor productivity) varies across industries and geography.
NEW: The 2023 BDS-Single Unit Firms covering the years 2007 to 2023 is now available! This release expands the revenue time series to cover 2007-2022. The 2023 release also includes applicable changes and improvements reflected in the 2023 BDS Release.
Download experimental Business Dynamics Statistics of Single Unit Firms with Revenue (BDS-SU-REV) data tables below.
Data Sources
The BDS-SU-REV is a product of the U.S. Census Bureau and was developed by the Center for Economic Studies (CES). The published statistics were tabulated from the Longitudinal Business Database (LBD), an internal Census data product that tracks firms over time, beginning in 1976. Quarterly employment, payroll and revenue data are sourced from IRS tax records integrated into the Census Bureau’s business data.
The Census Bureau has reviewed this data product to ensure appropriate access, use, and disclosure avoidance protection of the confidential source data used to produce this product (Data Management System (DMS) number: 7508369, Disclosure Review Board (DRB) approval number: CBDRB-FY26-0239).
This BDS experimental product supplements the September 2025 release of the core 2023 BDS tables. The same noise infusion disclosure avoidance methodology was used in these tables as in the previously released core tables to make statistics from both products comparable. See BDS Methodology for details.
Future releases of both the core BDS and this experimental product will implement disclosure avoidance in compliance with Department of Commerce DAO 216-26.
There are two versions of each BDS-SU-REV table, one with nominal revenue and payroll and one with inflation-adjusted revenue and payroll. For v2023, we use the Bureau of Economic Analysis (BEA) GDP implicit price deflator, with a base year of 2017.
Economy-wide Datasets

Number of Prior Active Quarters Datasets
Industry Datasets
Firm Size Datasets
Firm Age Datasets
Geography Datasets
Two-way Datasets with State
Two-way Datasets with Metro/Non-Metro
Two-way Datasets with MSA
Two-way Datasets with Industry
Three-way Datasets with Metro/Non-Metro
Three-way Datasets with State
Two-and Three-way Datasets with Firm Age and Firm Size

Glossary
Business Dynamics Statistics (BDS) – A public dataset on the LBD that describes United States business dynamics across a wide range of measures. Disclosure analysis is performed prior to release to the public to protect the confidentiality of the underlying LBD data.
Business Register (BR) – A comprehensive database of all U.S. business establishments developed and maintained by the U.S. Census Bureau, with data beginning in 1975 and continuing to the present. This is restricted data and is the source data for the Longitudinal Business Database (LBD).
Censoring – A statistical term indicating that a value cannot be known with certainty. Within the BDS, all firms/establishments born prior to 1976 have an unknown birth year and are therefore of an unknown age and are grouped into the age category “Left Censored”.
Data Quality Suppression – Data quality suppressions are made when a cell is determined to be unreliable due to its time series characteristics. Cells suppressed due to data quality concerns will appear as “S”. Disclosure Suppression – Disclosure suppressions are made when a cell has too few firms. Cells suppressed due to containing too few firms will appear as “D”.
Gross Domestic Product (GDP) Implicit Price Deflator – The price index produced by the Bureau of Economic Analysis (BEA), which is used to construct inflation-adjusted (real) payroll measures. The data can be found on FRED using the link below. In using this deflator, we maintain the 2017 base year.

Nominal Variables – Data that are unadjusted for inflation. Nominal data series are in “current” dollar terms.
Real Variables – Data that are adjusted for inflation. Real data series are in “constant” dollar terms.
Structurally Missing Flag – Structurally missing flags are applied to cells that are “structurally zero” or “structurally missing.” These are cells in the firm and establishment datasets where activity is not possible given the nature or structure of the BDS data. These cells appear as “X”. An example of a “structurally zero” cell is the variable ‘estabs_exit’ for firms age ‘0’. These cells will always be ‘0’ given the nature of data for firms age ‘0’. An example of a “structurally missing” cell is any variable for firms age ‘5’ in the years 1978 to 1981. These cells will always be missing for the years 1978 to 1981 because the source data for the BDS – the LBD – begins in 1976.
North American Industrial Classification System (NAICS) – NAICS is the standard used by Federal statistical agencies in classifying business establishments for the purposes of collecting, analyzing, and publishing statistical data released to the U.S. business economy. The system is used by the United States, Canada, and Mexico. Note that the 2023 BDS-SU-REV release is based on the 2017 NAICS vintage.
The BDS-SU-REV product follows the BDS methodology. Payroll creation and destruction are defined analogously to job creation and destruction, namely:
- Payroll Creation (PayC) – Payroll creation is the sum of all payroll gains from payroll-expanding firms from year t–1, quarter n to year t, quarter n including firm startups.
- Payroll Destruction (PayD) – Payroll destruction is the sum of all payroll losses from payroll-contracting firm (pleases from year t–1, quarter n to year t, quarter n including firms shutting down.
More precisely, definitions of pay creation, destruction, net change, and net change rate for firms classified in groups are given by:

Total revenue, revenue creation, and revenue destruction are defined the following way:
- Revenue in quarter n year t (Rev) – Annual Revenue (in thousands of dollars) at single-establishment firms with positive employment in quarter n in year t (active in quarter n in year t). Note that revenue is an annual measure while active status is defined at the quarterly level.
- Revenue Creation in quarter n year t (RevC) – Revenue creation is the sum of all revenue gains from revenue-expanding firms from year t–1 to year t including firm startups.
- Revenue Destruction in quarter n year t (RevD) – Revenue destruction is the sum of all revenue losses from revenue-contracting firms from year t–1 to year t including firm closures.
Time Frame and Single-Unit Firm Universe
The BDS-SU-REV product is available from 2007-2023, which is a substantially shorter time frame than the main BDS. The quarterly IRS employment variables were first collected in 2004 and but the data were not of high enough quality to use for publication until 2005. Our data cleaning algorithm uses year t-2 data to edit year t-1 and year t-1 to edit year t data, resulting in a clean pair of t and t-1 employment and payroll values for each year in the time series. For this reason, we begin our time series with the 2006-2007 year comparison, using 2005 as the baseline year for editing 2006 data (see Redesigning the Longitudinal Business Database (census.gov), page 45).
Prior releases of BDS-SU-REV included revenue statistics only for 2017-2022. This 2023 release extends the revenue time series back in time to match the employment and payroll time series. Annual revenue changes are now measured from 2006-2007 to 2021-2022. The last year of revenue data available (2023) is not published because of quality issues due to late filing of business tax returns. The 2023 revenue data will be released with the next version of BDS-SU-REV.
The BDS-SU-REV universe is defined as all the firms that the Census Business Register has determined to be operating in a single physical location during a given year. The main reason to exclude multi-unit firms is that payroll and employment are reported to the IRS at an aggregate level for these types of firms. The Census Bureau models the allocation of firm payroll and employment to individual establishments within a multi-unit firm for quarter 1 of each year but does not allocate additional quarters. In addition, the scope of the single-unit population is honed to the same industry and geography requirements as the main BDS (see Redesigning the Longitudinal Business Database (census.gov), page 46).
Transitions in Single-unit Status
Each year some firms transition from having multiple establishments to having only one and vice versa. The multi-unit to single-unit transitions (MU-SU) in year t create a set of firms that belong to the single-unit universe, but which don’t have clearly defined employment and payroll flows beyond quarter 1. Establishments that belong to multi-unit firms in year t-1 don’t have quarter 2 – 4 employment and payroll for year t-1 and hence we cannot measure job creation and destruction between year t-1 and t in any quarter except quarter 1. Thus, for these cases, we set all employment flows to zero and simply include the relevant employment in total employment for the year. This assumption treats MU-SU transitions as if they had experienced constant employment across the two years. By definition, they are continuers, having operated in year t-1 and year t, and are not counted as entrants.
If a single-unit firm grows and opens additional establishments, i.e., new locations, it becomes a multi-unit (SU-MU transition). This type of change will remove the firm from the single-unit universe, beginning with the SU-MU transition year, and drop the associated employment from the totals. We do not count any employment flows from this type of transition, nor do we label the firm as an exit.
In the main BDS, the year t establishment count is equal to the year t-1 count plus entrants and minus exits plus the net effect of any scope changes that move establishments in and out of the BDS universe. The same is true to an even larger extent in the BDS-SU-REV tables because of transitions in and out of multi-unit status. Abstracting away from other scope changes, in the BDS-SU, the year t, quarter n establishment count is equal to the year t-1, quarter n count plus entrants, minus exits, plus MU-SU transitions, and minus SU-MU transitions. These transitions happen most often in Economic Census years or in the year immediately after an Economic Census. They represent a small percentage of establishments in each year (.1% on average) but sometimes have out-sized effects on more granular cells. In particular, there are occasions where a few large transitions cause relatively large changes in employment without corresponding job creation or destruction. This happens because employment moves in or out of the single-unit universe without being counted as an entrant or exit, as explained above. Research is on-going about how to improve measurement of the timing of these transitions, as well as how to account for the employment flows.
Relationship Between Entrants, Exits, Firm Age, and Number of Prior Active Quarters
Both the main BDS and the BDS single-units rely on year-over-year changes. This approach minimizes the effect of seasonality, or patterns in the data that occur every year due to weather, holiday timing, or other factors that affect the operation of certain types of businesses. By comparing year t data to the same point in year t-1, we measure employment changes due to underlying economic factors instead of changes from one season to the next. However, this method means that a firm entry or exit will generally be counted as such for multiple quarters. For example, if a firm operated continuously until quarter 2 of year t, it will be defined as an exit because it was still in operation in quarter 2 of year t-1. If it remains closed in quarter 3 of year t, it will again be classified as an exit because it was in operation in quarter 3 of year t-1. The same is true for births. Thus, when reporting all the entrants and exits for a quarter, there is some ambiguity about how many of them, in fact, first happened in that quarter.
For births, this problem is solved by using quarterly firm age. Age zero entrants in any quarter are “true” births, i.e., opening firms that have never operated before. Entrants between ages one and three in any quarter are firms operating for the first time in that quarter that initially opened in one of the prior three quarters. To mimic this concept for firm exit, we created a count of active quarters in the immediately preceding three quarters. In their first quarter with no payroll or employment, exiting firms will be categorized as having three prior active quarters. In the second quarter after cessation of activity, the exit will have only two prior active quarters, and so on until the fourth quarter when they will have zero prior active quarters. We use the number of prior active quarters as a by-variable in a one-way table to show the precise timing of exits.
Some businesses may close for one or two quarters and then re-open. This may happen for seasonal reasons (winter or summer recreation activities, specialty holiday retail, etc.) but also due to temporary economic shocks. The number of prior active quarters helps to trace out the pattern of exit and reactivation. The number of exits in quarter n with only two prior active quarters (i.e., not a first-time exit) is lower than the number of exits in quarter n-1 with three prior active quarters (i.e., first-time exits) and the difference is due to reactivations, in this case firms that closed for a single quarter and then re-opened. Large jumps relative to the historical time trend of exits with three prior active quarters followed by a return to more normal levels of exits with two prior active quarters in the subsequent quarter can signify a temporary economic disruption followed by a recovery as some businesses re-open.
Payroll and Revenue Deflation
As in any monetary time series, it is important to account for inflation when comparing values over time. The BDS-SU-REV tables include both nominal and real payroll versions. Real payroll is calculated using the GDP Price Deflator from the Bureau of Economic Analysis (BEA). We use the formula: real payroll = current year payroll * (100/GDP deflator) and maintain the Metro/Non-Metro base year of 2017.
Below are links to selected publications related to the BDS-Single Unit Firms.
Beem, Richard, Christopher Goetz, Martha Stinson, Sean Wang, 2022. "Business Dynamics Statistics for Single-Unit Firms," CES Discussion Paper Series, CES-WP-22-57.
Questions? Contact us at [email protected].