Coverage Ratio Visualizations
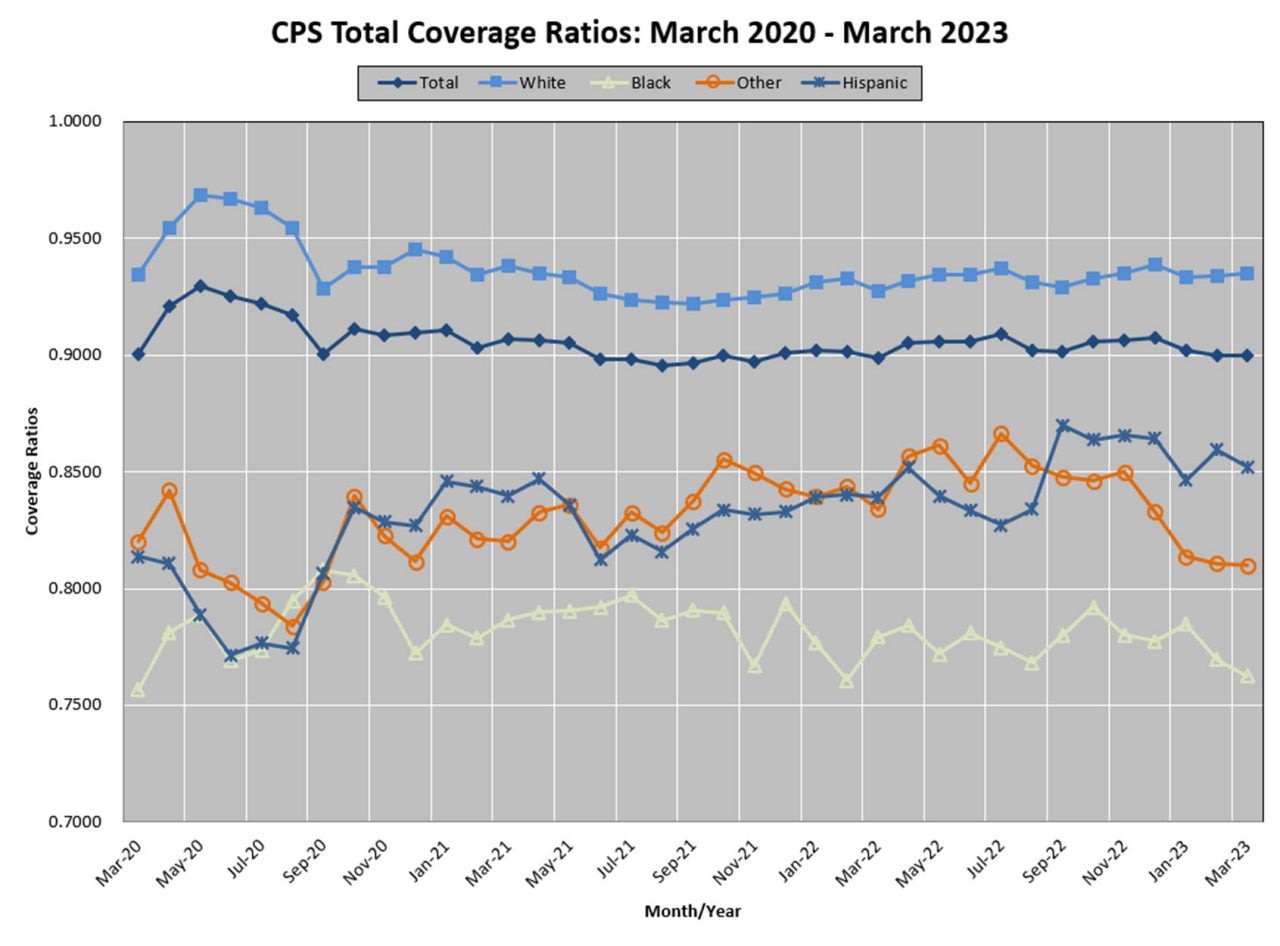
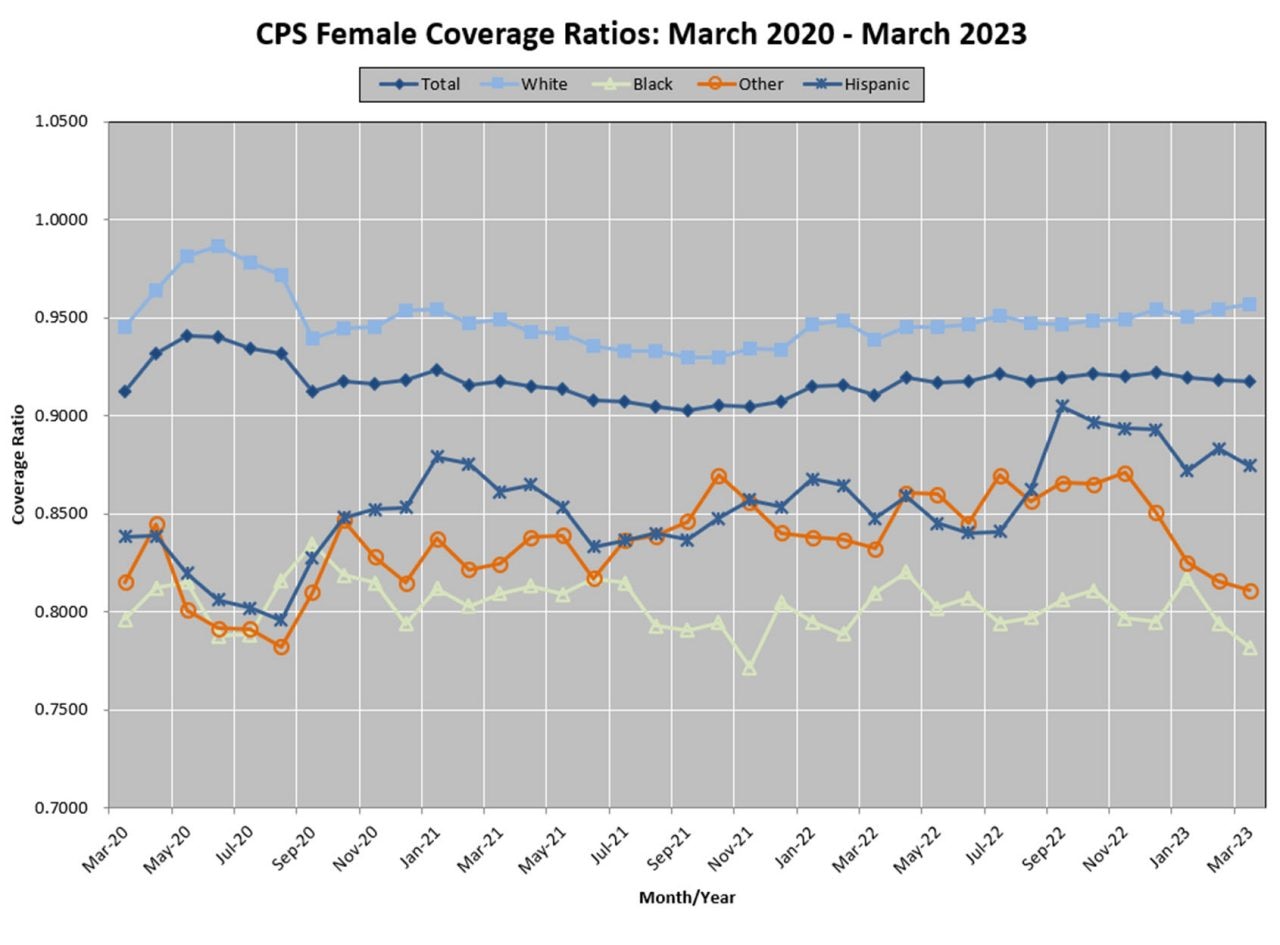
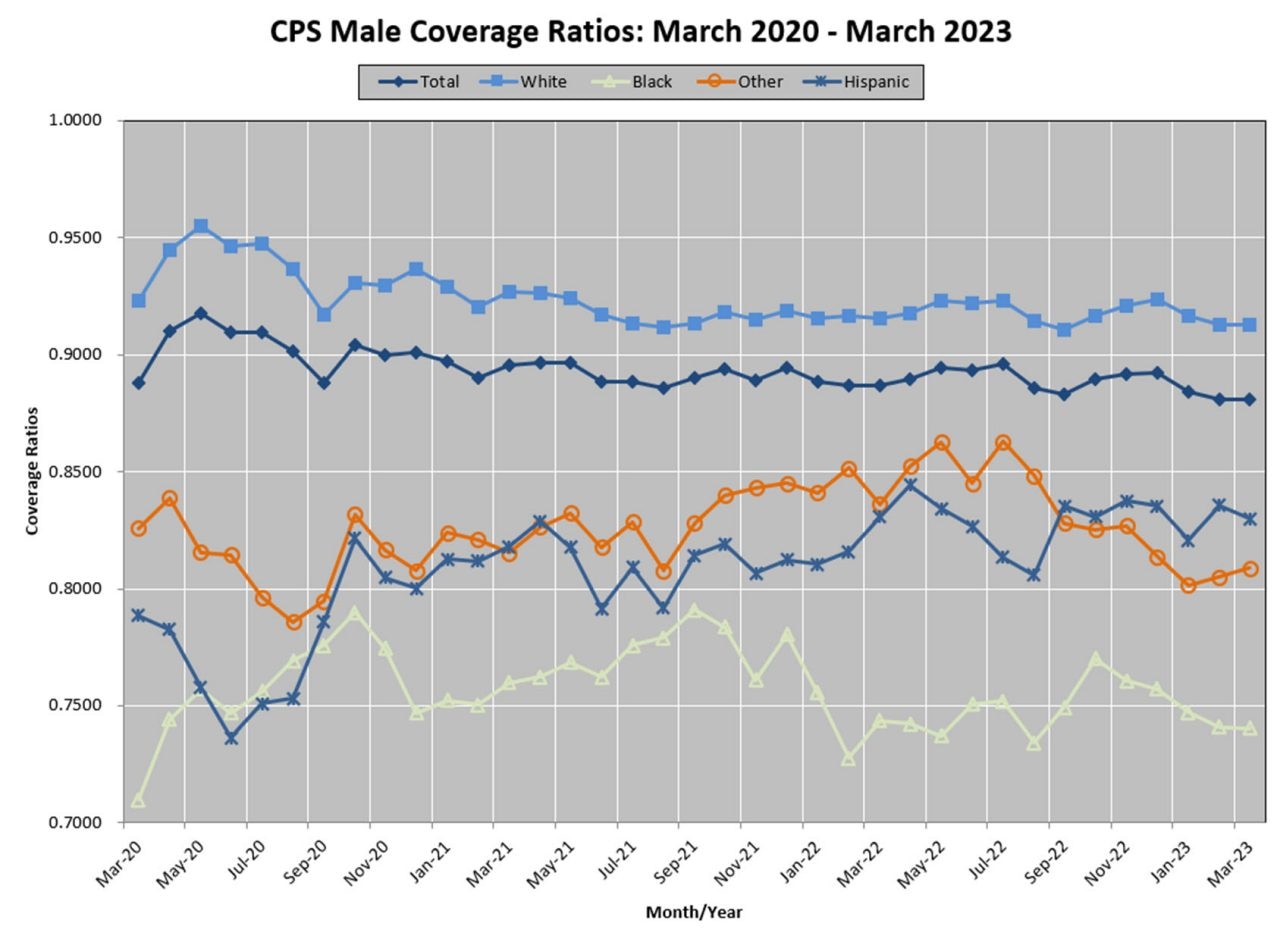
The three graphs provide a picture of coverage, for the 16+ population, in the CPS over the last three years. The first one gives the coverage ratios for racial groups. Traditionally, Blacks and Hispanics have been the most underrepresented in CPS. The other two graphs show the coverage ratios by race and gender. Coverage ratios are lowest for Black and Hispanic males.
CPS Total Coverage Ratios: March 2020-March 2023
CPS Female Coverage Ratios: March 2020-March 2023
CPS Male Coverage Ratios: March 2020-March 2023
Learn More
Page Last Revised - April 27, 2023