Mozambique: Population Vulnerability and Resilience Profile
Mozambique: Population Vulnerability and Resilience Profile
Summary
Demography
When compared to the rest of the world, the population of Mozambique is growing quicker, is less urban (38 percent urban in 2021), less densely clustered, has lower life expectancy (57.1 years in 2022), and lower levels of education (3.5 mean years of schooling in 2019). Substantial disparities are observable between genders, among provinces, and between urban and rural areas. Mozambique also has a higher dependency ratio (92.9 in 2022), higher prevalence of the human immunodeficiency virus (HIV) (13.2 percent in 2015), and malaria is responsible for almost 30 percent of deaths.1 At a subnational level, there are substantial educational differences among provinces and population groups, with Cabo Delgado and Niassa having the lowest level of literacy for women.
Economy
Mozambique has lower levels of economic development, with rain-fed agriculture being the main source of livelihood for most of the population. There are substantial differences between urban and rural areas and among provinces.
Infrastructure
In 2015, only one-half of Mozambicans had access to safe water, and only 1 in 5 households had access to improved sanitation. Less than 30 percent of households had access to electricity in 2018; in four provinces (Zambézia, Tete, Cabo Delgado, and Niassa), less than 15 percent of households had access to electricity. Few households in rural areas of Mozambique—less than 10 percent—have access to electricity, internet, computer, coverage of mobile phones, and improved sanitation.
Environment
Mozambique is one of the most vulnerable countries to extreme weather-related issues, such as drought, flooding, and cyclones. Since 2001, Mozambique has lost 13 percent of its tree-covered area and has experienced an increasing level of soil degradation. Among all regions, the province of Zambézia had the highest tree cover loss since 2001 at 16 percent. Climate change is expected to bring an increase in the mean temperature, more hot nights, and an increasing number of extreme weather events such as drought, floods, and cyclones.
Demographic Dimension
Situated in southeastern Africa, Mozambique has a population of 31.7 million as of 2022 (38 percent is urban as of 2021).2,3 Life expectancy is among the lowest in the world at 57.1 years in 2022, and its population density of 40.3 people per square kilometer is low relative to other countries and areas in Africa.4,5 Mozambique has one of the youngest populations in the world, with more than one-half of the population (56.1 percent) aged 19 and below (Figure 1). Mozambique has a high rate of HIV (13.2 percent of those aged 15–49 in 2015) and malaria is endemic in the population, accounting for 29 percent of all deaths and 42 percent of deaths in children under the age of 5.6,7

Since 2000, Mozambique’s population has increased 70 percent from about 18.5 million to about 31.7 million, with an annual growth rate of 2.6 percent in 2022. The total fertility rate in 2022 was 4.8, higher than most other countries but more than 25 percent lower than in 1980 (total fertility rate of 6.5).8 The large number of young people lead to a very high dependency ratio of 92.9 percent in 2022, a potential vulnerability when the society is confronted with natural disasters or economic crises.9
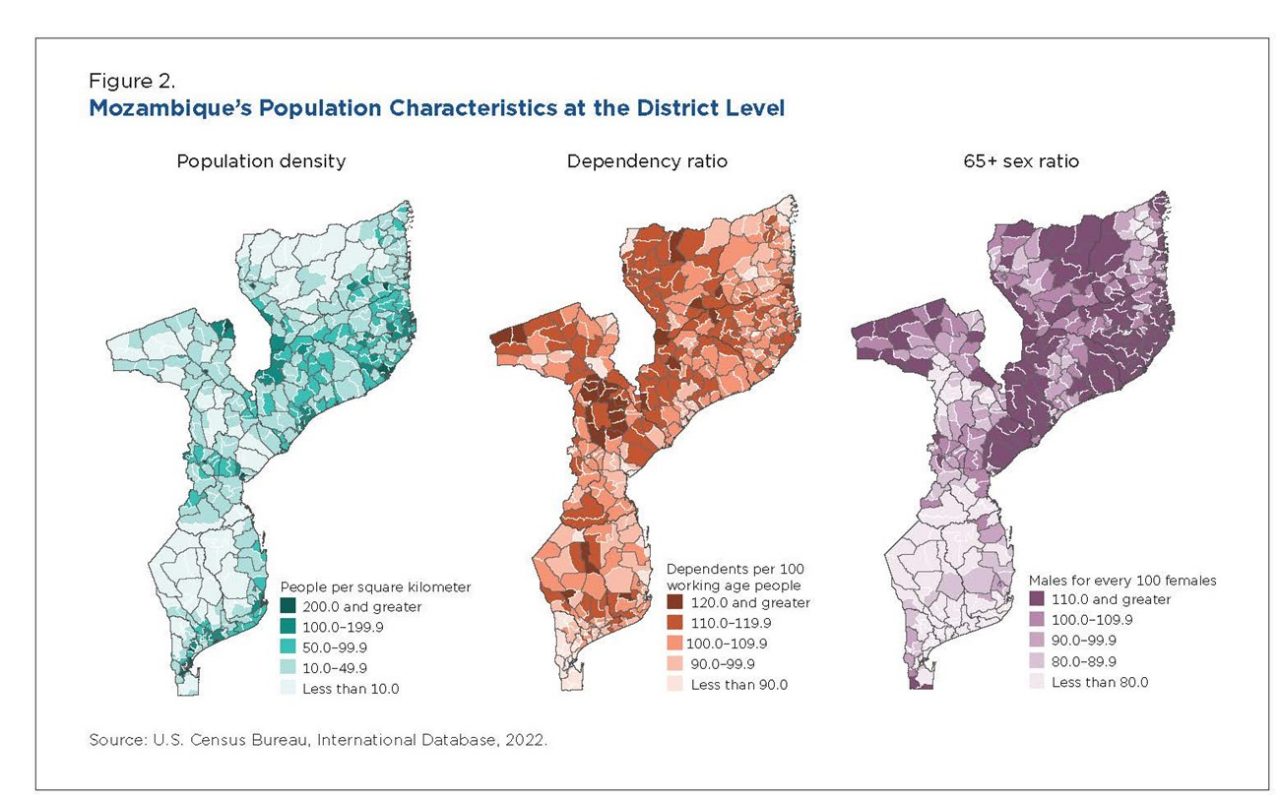
At the subnational level, there are substantial differences among provinces and districts in terms of population density and dependency ratio. Most of the provinces have a low population density, except for Maputo City. In terms of dependency ratio, districts in the Niassa, Tete, Zambezia, and Sofala provinces have dependency ratios greater than 100 percent (Figure 2).
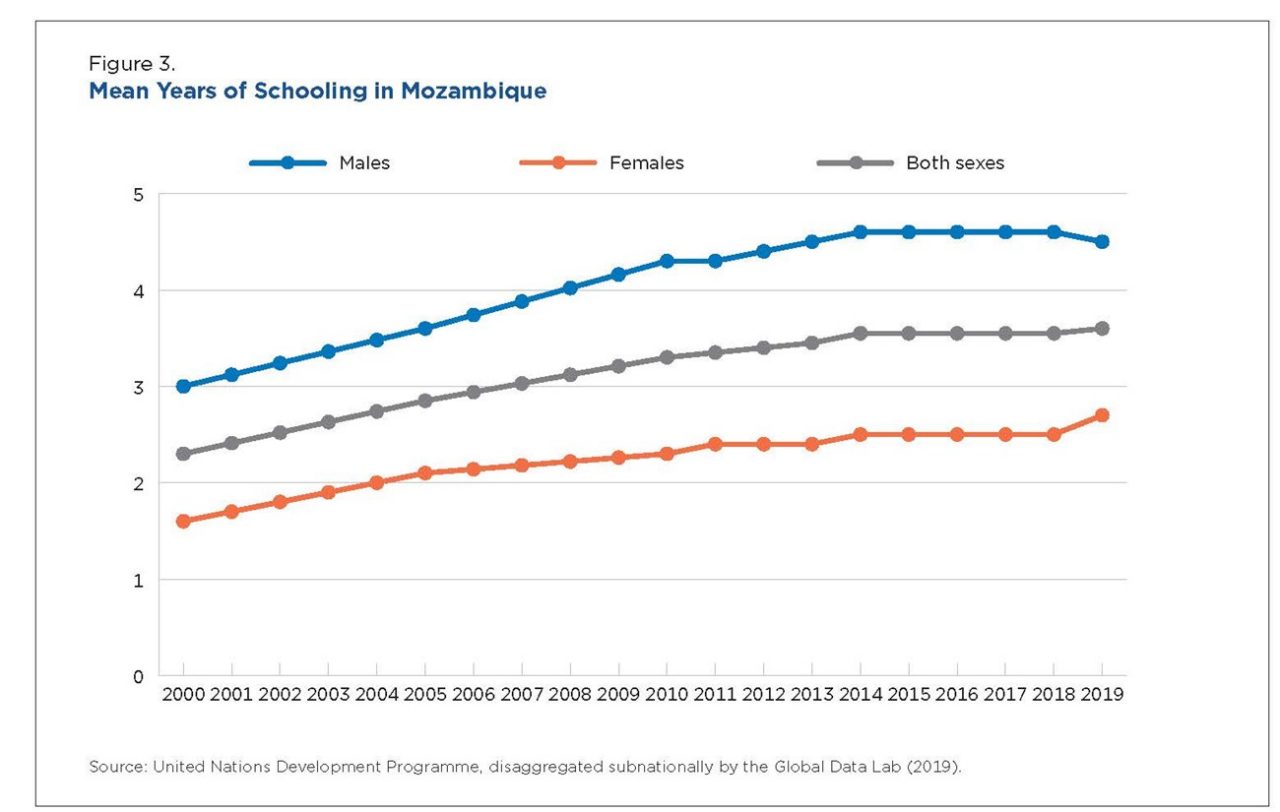
Mozambique has a low Human Development Index (185 out of the 191 countries in 2021) and its population has a low level of education with an average of 3.5 years of schooling in 2019, or 4.5 years for men and 2.7 years for women (Figure 3).10,11 There are substantial differences at the subnational level, as only 17.5 percent of women in Cabo Delgado and 28.1 percent in Niassa were literate in 2018, compared with 90.0 percent in the city of Maputo.12
Economic Dimension
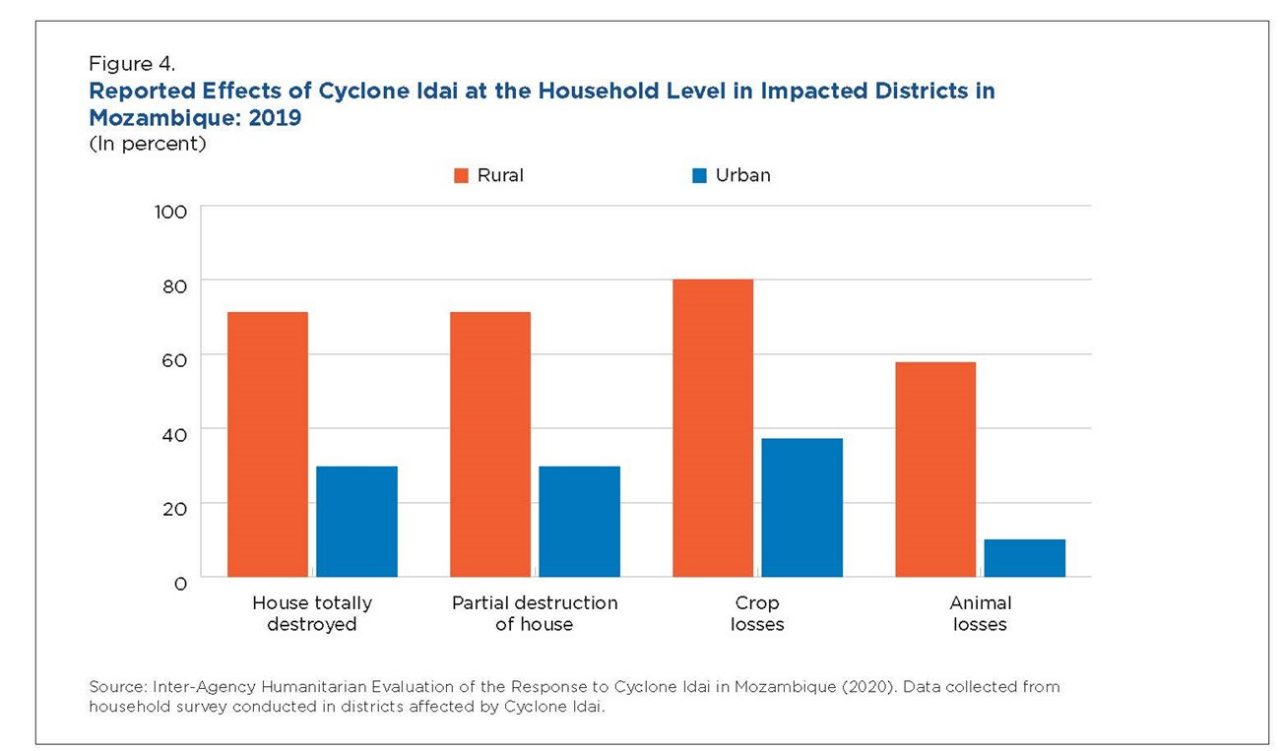
Mozambique was the seventh poorest country in the world in 2020, with a per capita gross domestic product purchasing power parity (GDP) (PPP) of $1,297.30.13 While Mozambique’s economy has been affected by the COVID-19 pandemic and its GDP had a negative growth rate in 2020 (–1.2 percent), the economy improved in 2021 and 2022 with annual GDP growth rates of 2.2 percent (estimated) and 3.6 percent (forecasted).14 Agriculture, forestry, and fishing represented 25.6 percent of the GDP in 2020.15 Most agriculture is rain fed (80 percent), making it vulnerable to weather- and climate-related hazards.16 In 2019 alone, two powerful cyclones (Idai and Kenneth) made landfall in Mozambique. Idai mostly affected the central provinces (Zambezia, Sofala, and Manica) and had a large demographic and economic impact, causing 600 deaths and leaving 1.85 million people in need of financial support (Figure 4).17
The poverty rate is high in Mozambique at 63.5 percent.18 Per capita GDP is decreasing despite overall positive economic growth in 2021–2022 due to the high population growth rate.
At the subnational level, poverty tends to be higher in the northern provinces (Cabo Delgado, Nassa, Nampula, and Zambezia) than in the southern provinces, especially the province of Maputo and the city of Maputo. This year in Cabo Delgado, Nampula, Niassa, and Zambezia, 1.1 million people are expected to be food insecure, in crisis, or worse.19 The Northern region has had an ongoing conflict since 2017 and it was also heavily impacted by Cyclone Kenneth in 2019. As of 2022, 784,000 people from northern Mozambique have been internally displaced and the ongoing armed conflict is a key driver for food insecurity in the area.20,21
Infrastructure Dimension
Clean Water and Sanitation
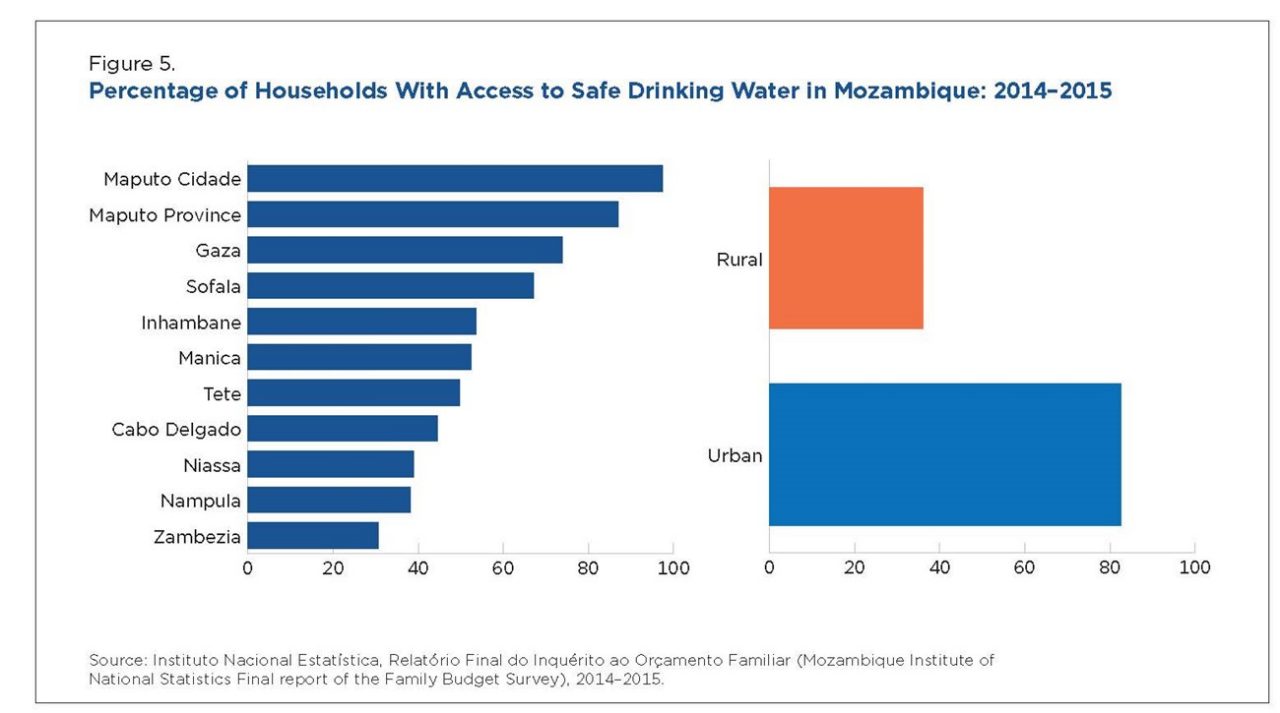
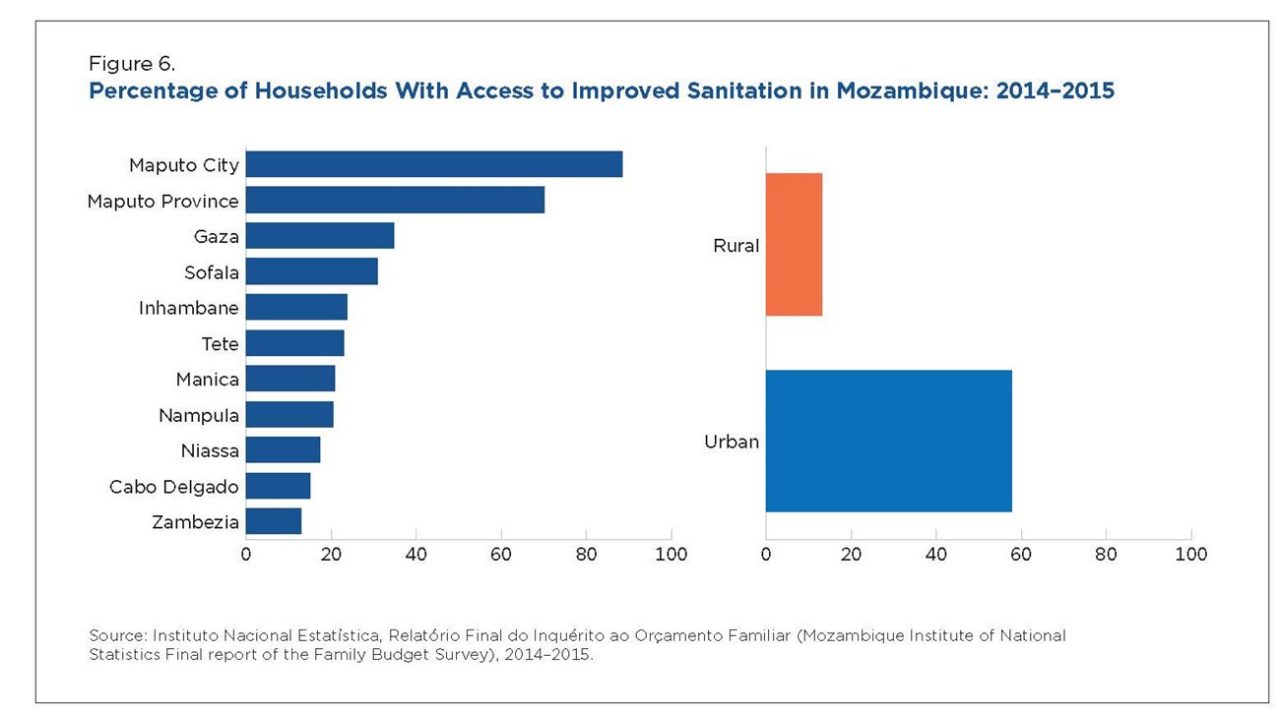
Only one-half of Mozambican households have access to safe water, and only 26.9 percent of households use improved sanitation, with notable differences between urban and rural areas and significant variation among the provinces (Figures 5 and 6).
Electrical Grid
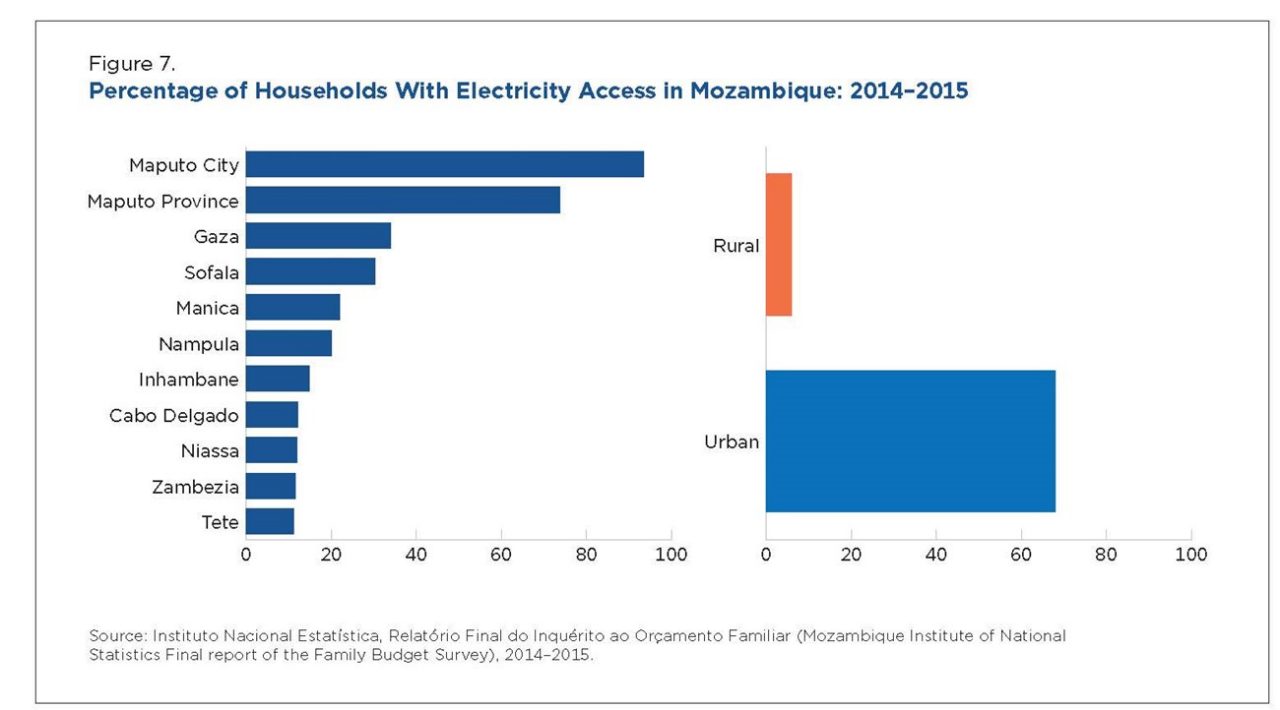
In 2018, only 27.9 percent of households had access to electricity in Mozambique.22 In 2014, 68 percent of households in urban areas had access to electricity, whereas only 6 percent of rural households had access (Figure 7). In the city of Maputo, 95.4 percent of households had electricity in 2018, but households in the northern provinces had much lower levels. For example, only 10.2 percent of households had access to electricity in Niassa, 12.5 percent in Cabo Delgado, and 13.3 percent in Zambézia.23
Although access to computers and the internet is low across Mozambique, households in urban areas have greater access to these technologies. Almost one-half of households (42.0 percent) in urban areas have access to cell phones, compared to 18.4 percent in rural areas.
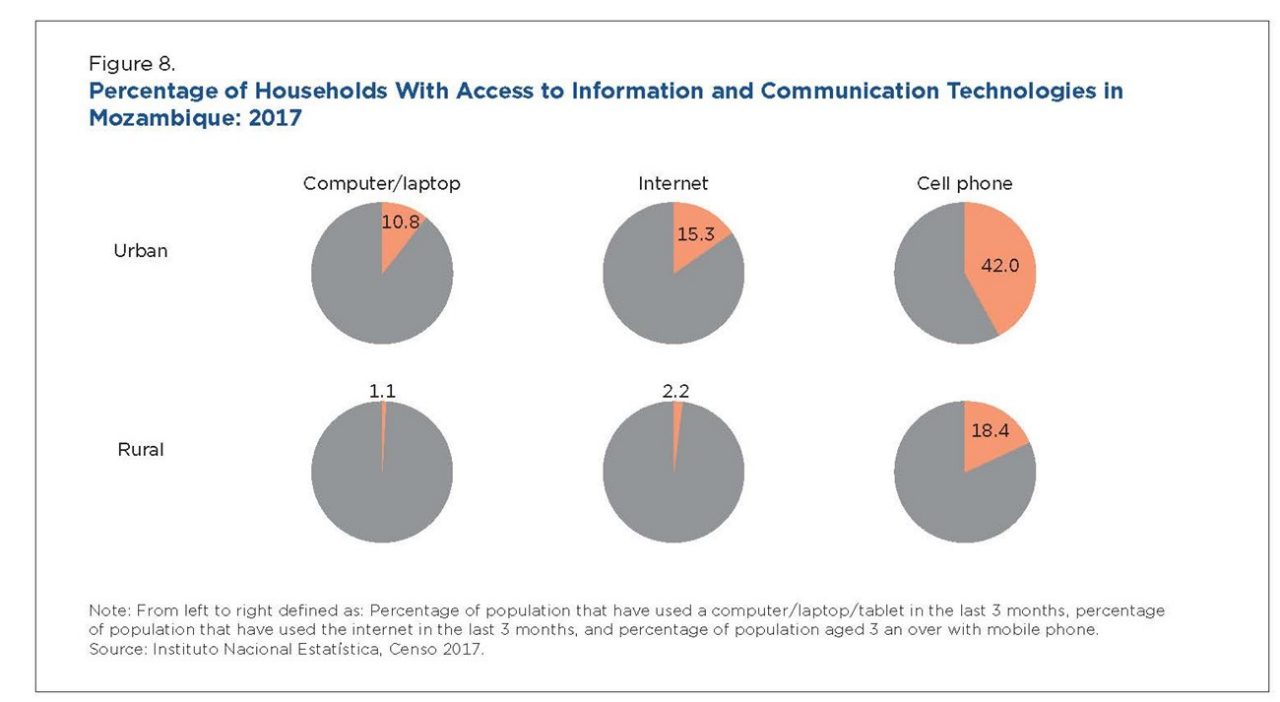
In Figure 8, each circle represents the proportion of the specified regional population with access to the indicated information or communication technology.
Environmental Dimension
Because of its long coastline, Mozambique is one of the countries most vulnerable to environmental hazards (droughts, floods, cyclones) and to the effects of climate change. The Notre Dame Global Adaptation Initiative Index consistently ranks Mozambique among the countries with high vulnerability and low readiness.24
Forests covered 34 percent of Mozambique’s land area in 2010, but forest cover is being lost at a higher rate than the global average. Between 2001 and 2021, 13 percent of tree cover was lost in Mozambique compared to 11 percent globally.25,26 Eight million hectares of forest (roughly the size of Portugal) have been lost in the past 50 years, mostly because of unsustainable agricultural practices.27 As of 2010, three provinces (Zambezia, Nassa, and Cabo Delgado) had more than one-half of all the tree cover (53 percent in 2000) with Zambezia also having the highest rate of deforestation (16 percent) among provinces from 2001 to 2021.
Climate change will only make these issues worse. Mozambique has a tropical and subtropical climate that is influenced by the El Niño/Southern Oscillation climate pattern, its mountains, and its long coastline. At least two severe droughts (1982–1983 and 1991–1992) that affected central and southern Mozambique have been linked to the El Niño effect.
Rainfall distribution follows a north-south gradient, with the coastal areas receiving the highest amount of rain, followed by the high altitude inland and Central/Southern regions.28 In terms of climate change effects, the temperature is expected to increase by 1.4–3.7 degrees Celsius by 2060 (Figure 8).29,30
When an intermediate scenario regarding future emissions is used (RCP 4.5, where emissions are supposed to increase until 2040 and decrease after that), Mozambique can expect to see an increase in the number of days above 95 degrees Fahrenheit by the year 2100, from (at the median probability) 21.6 days for the period 2020–2039, 33.1 days for 2040–2059, and up to 44.8 days for the period 2080–2099.31,32 Both the average winter and summer temperatures for Mozambique are projected to increase by about 1.5 degrees Fahrenheit over the period 2020–2099.
——————————————————————————————
1 Dependency ratio is calculated as the ratio of the dependent-age population (young and old) to the working-age population.
2 U.S. Census Bureau, International Database (IDB), 2022, <www.census.gov/data-tools/demo/idb/#/country?COUNTRY_YEAR=2022&COUNTRY_YR_ANIM=2022&FIPS_SINGLE=MZ>, accessed on 05/30/2022.
3 World Bank, “Urban population (% of total population) – Mozambique,” 2022, <https://data.worldbank.org/indicator/SP.URB.TOTL.IN.ZS?locations=MZ>, accessed on 05/30/2022.
4 U.S. Census Bureau, International Database (IDB), 2022, <www.census.gov/data-tools/demo/idb/#/country?COUNTRY_YEAR=2022&COUNTRY_YR_ANIM=2022&FIPS_SINGLE=MZ>, accessed on 05/30/2022.
5 Ibid.
6 The Demographic and Health Surveys Program (DHS), STATcompiler, <www.statcompiler.com/en/>, accessed on 05/30/2022.
7 Center for Disease Control and U.S. Agency for International Development, “U.S. President’s Malaria Initiative. Mozambique,” 2022, <www.pmi.gov/where-we-work/mozambique/> accessed on 05/30/2022.
8 U.S. Census Bureau, International Database (IDB), 2022, <www.census.gov/data-tools/demo/idb/#/country?COUNTRY_YEAR=2022&COUNTRY_YR_ANIM=2022&FIPS_SINGLE=MZ>, accessed on 05/30/2022.
9 Ibid.
10 United Nations Development Programme (UNDP), Human Development Report 2021-22: Uncertain Times, Unsettled Lives: Shaping our Future in a Transforming World, New York, 2022, <https://hdr.undp.org/content/human-development-report-2021-22>, accessed on 10/26/2022.
11 Global Data Lab, Indicators – Table – Subnational HDI – Global Data Lab, 2019, <https://globaldatalab.org/shdi/table/shdi/>, accessed on 10/26/2022.
12 Instituto Nacional de Saúde (INS) and International Classification of Functioning, Disability, and Health, Inquérito Nacional sobre Indicadores de Malária em Moçambique, Maputo, Moçambique, and Rockville, Maryland, 2018.
13 World Bank, “GDP per Capita, PPP (Current International $) – Mozambique,” 2022b, <https://data.worldbank.org/indicator/NY.GDP.PCAP.PP.CD?locations=MZ&most_recent_value_desc=false>, accessed on 05/30/2022.
14 World Bank, Mozambique,” <https://documents1.worldbank.org/curated/en/099139404272234694/pdf/IDU0f48ffb4e0438e041350946006842d1402791.pdf>, 2022, retrieved on 05/30/2022.
15 World Bank, “Agriculture, Forestry, and Fishing, Value Added (% of GDP) – Mozambique,” 2022, <https://data.worldbank.org/indicator/NV.AGR.TOTL.ZS?locations=MZ>, retrieved on 05/30/2022.
16 Osiemo, Jamleck and Brasilino das Virtudes Salvador, “Climate-Smart Agriculture in Mozambique,” International Center for Tropical Agriculture (CIAT), the CGIAR Research Program on Climate Change, Agriculture and Food Security (CCAFS), the World Bank, and the UK Government’s Department for International Development (DFID), 2017, <https://cgspace.cgiar.org/bitstream/handle/10568/83483/CSApercent20_Profile_Mozambique.pdf?sequence=8&isAllowed=y>, accessed on 05/30/2022.
17 United Nations Office for the Coordination of Humanitarian Affairs (UNOCHA), “Cyclones Idai and Kenneth, 2022, <www.unocha.org/sites/unocha/files/IAHE%20Mozambique_final%20report.pdf>, accessed on 05/01/2022.
18 World Bank, “Mozambique,” 2021, <https://documents1.worldbank.org/curated/en/099423004262231188/pdf/IDU0802c1f8f0a1f10422108fed05ba4809dd119.pdf>, accessed on 05/30/2022.
19 World Food Programme and Food and Agriculture Organization (WFP and FAO), “Hunger Hotspots. FAO-WFP Early Warnings on Acute Food Insecurity: June to September 2022 Outlook,” 2022, <www.wfp.org/publications/hunger-hotspots-fao-wfp-early-warnings-acute-food-insecurity-june-september-2022>, accessed on 05/30/2022.
20 Relieweb, “UNHCR Mozambique Cabo Delgado External Update - IDP Response, June 2022,” <https://reliefweb.int/report/mozambique/unhcr-mozambique-cabo-delgado-external-update-idp-response-june-2022#:~:text=More%20than%20784%2C000%20people%20are,Cabo%20Delgado%20and%20neighboring%20provinces>, accessed on 06/01/2022.
21 World Food Programme and Food and Agriculture Organization (WFP and FAO), “Hunger Hotspots. FAO-WFP Early Warnings on Acute Food Insecurity: June to September 2022 Outlook,” 2022, <www.wfp.org/publications/hunger-hotspots-fao-wfp-early-warnings-acute-food-insecurity-june-september-2022>, accessed on 05/30/2022..
22 Instituto Nacional de Saúde (INS) and International Classification of Functioning, Disability, and Health (ICF), Inquérito Nacional sobre Indicadores de Malária em Moçambique, Maputo, Moçambique, and Rockville, Maryland, 2018.
23 Instituto Nacional de Saúde (INS) and ICF, Inquérito Nacional sobre Indicadores de Malária em Moçambique, Maputo, Moçambique, and Rockville, Maryland, 2018.
24 University of Notre Dame, “ND-GAIN> Notre Dame Global Adaptation Initiative,” 2022, <https://gain.nd.edu/our-work/country-index/>, accessed on 05/01/2022.
25 Global Forest Watch, “Mozambique. Forest Change,” 2022, <www.globalforestwatch.org/dashboards/country/MOZ/?category=forest-change&dashboardPrompts=eyJzaG93UHJvbXB0cyI6dHJ1ZSwicHJvbXB0c1ZpZXdlZCI6WyJkYXNoYm9hcmRBbmFseXNlcyJdLCJzZXR0aW5ncyI6eyJzaG93UHJvbXB0cyI6dHJ1ZSwicHJvbXB0c1ZpZXdlZCI6W10sInNldHRpbmdzIjp7Im9wZW4iOmZhbHNlLCJzdGVwSW5kZXgiOjAsInN0ZXBzS2V5IjoiIn0sIm9wZW4iOnRydWUsInN0ZXBJbmRleCI6MCwic3RlcHNLZXkiOiJkYXNoYm9hcmRBbmFseXNlcyJ9LCJvcGVuIjp0cnVlLCJzdGVwc0tleSI6ImRvd25sb2FkRGFzaGJvYXJkU3RhdHMifQ%3D%3D&location=WyJjb3VudHJ5IiwiTU9aIl0%3D&map=eyJjZW50ZXIiOnsibGF0IjotMTguODY5MzgyMzY3MTEzNDIsImxuZyI6MzUuNTI3Mzg3NjIwMDA1NjI2fSwiem9vbSI6NC4wMDM1OTA2MDUwMjYxMjQsImNhbkJvdW5kIjpmYWxzZSwiZGF0YXNldHMiOlt7ImRhdGFzZXQiOiJwb2xpdGljYWwtYm91bmRhcmllcyIsImxheWVycyI6WyJkaXNwdXRlZC1wb2xpdGljYWwtYm91bmRhcmllcyIsInBvbGl0aWNhbC1ib3VuZGFyaWVzIl0sImJvdW5kYXJ5Ijp0cnVlLCJvcGFjaXR5IjoxLCJ2aXNpYmlsaXR5Ijp0cnVlfSx7ImRhdGFzZXQiOiJ0cmVlLWNvdmVyLWxvc3MiLCJsYXllcnMiOlsidHJlZS1jb3Zlci1sb3NzIl0sIm9wYWNpdHkiOjEsInZpc2liaWxpdHkiOnRydWUsInRpbWVsaW5lUGFyYW1zIjp7InN0YXJ0RGF0ZSI6IjIwMDEtMDEtMDEiLCJlbmREYXRlIjoiMjAyMS0xMi0zMSIsInRyaW1FbmREYXRlIjoiMjAyMS0xMi0zMSJ9LCJwYXJhbXMiOnsidGhyZXNob2xkIjozMCwidmlzaWJpbGl0eSI6dHJ1ZX19XX0%3D&showMap=true>, accessed on 05/30/2022.
26 Global Forest Watch, “Global,” 2022, <www.globalforestwatch.org/dashboards/global/?category=summary&location=WyJnbG9iYWwiXQ%3D%3D&map=eyJkYXRhc2V0cyI6W3siZGF0YXNldCI6InBvbGl0aWNhbC1ib3VuZGFyaWVzIiwibGF5ZXJzIjpbImRpc3B1dGVkLXBvbGl0aWNhbC1ib3VuZGFyaWVzIiwicG9saXRpY2FsLWJvdW5kYXJpZXMiXSwiYm91bmRhcnkiOnRydWUsIm9wYWNpdHkiOjEsInZpc2liaWxpdHkiOnRydWV9LHsiZGF0YXNldCI6Ik5ldC1DaGFuZ2UtU1RBR0lORyIsImxheWVycyI6WyJmb3Jlc3QtbmV0LWNoYW5nZSJdLCJvcGFjaXR5IjoxLCJ2aXNpYmlsaXR5Ijp0cnVlLCJwYXJhbXMiOnsidmlzaWJpbGl0eSI6dHJ1ZSwiYWRtX2xldmVsIjoiYWRtMCJ9fV19&showMap=true>, accessed 10/27/2022.
27 World Bank, “Forests of Mozambique: A Snapshot,” 2018, <www.worldbank.org/en/news/infographic/2018/12/12/forests-of-mozambique-a-snapshot#:~:text=Mozambiquepercent20ispercent20apercent20countrypercent20with,environmentalpercent20andpercent20economicpercent20wellpercent2Dbeing>, accessed on 05/30/2022.
28 Dyoulgerov, Milen, Ana Bucher, Fernanda Zermoglio, and Claudio Forner, “Vulnerability, Risk Reduction, and Adaptation to Climate Change. Mozambique,” Global Facility for Disaster Reduction and Recovery, the Global Support Program of the Climate Investment Funds, and the Climate Change Team of the Environment Department of the World Bank, <https://climateknowledgeportal.worldbank.org/sites/default/files/2020-04/wb_gfdrr_climate_change_country_profile_for_MOZ_0.pdf>, accessed on 05/30/2022.
29 “Heavy rainfall events” are defined as daily rainfall total which exceeds the threshold that is exceeded on 5 percent of rainy days in the current climate of that region or season.
30 Dyoulgerov, Milen, Ana Bucher, Fernanda Zermoglio, and Claudio Forner, “Vulnerability, Risk Reduction, and Adaptation to Climate Change. Mozambique,” Global Facility for Disaster Reduction and
Recovery, the Global Support Program of the Climate Investment Funds, and the Climate Change Team of the Environment Department of the World Bank, <https://climateknowledgeportal.worldbank.org/sites/default/files/2020-04/wb_gfdrr_climate_change_country_profile_for_MOZ_0.pdf>, accessed on 05/30/2022.
31 Representative Concentration Pathways (RCPs) are projections of radiative forcing components that are meant to serve as input for climate modeling, pattern scaling and atmospheric chemistry modeling. The RCP 4.5 scenario is a stabilization scenario, meaning that the radiative forcing level stabilizes at 4.5 W/m2 before 2100, < https://sos.noaa.gov/catalog/datasets/climate-model-temperature-change-rcp-45-2006-2100/>.
32 Intergovernmental Panel On Climate Change (IPCC), “Climate Change 2014 Synthesis Report Fifth Assessment Report. Future Changes,” 2014, <https://ar5-syr.ipcc.ch/topic_futurechanges.php> accessed on 05/30/2022.