The Supplemental Poverty Measure: 2020
The Supplemental Poverty Measure: 2020
Introduction

Since the publication of the first official U.S. poverty estimates in the 1960s, researchers and policymakers have continued to discuss the best approach to measure income and poverty in the United States. Beginning in 2011, the U.S. Census Bureau began publishing the Supplemental Poverty Measure (SPM), which extends the official poverty measure by taking account of many of the government programs designed to assist low-income families and individuals that are not included in the official poverty measure. The SPM is produced with the support of the Bureau of Labor Statistics (BLS), and this report is the eleventh in the series. This report presents estimates of the prevalence of poverty in the United States using the official measure and the SPM based on information collected in 2021 and earlier Current Population Survey Annual Social and Economic Supplements (CPS ASEC).
In 2020, several methodological improvements were applied to both the resource and threshold estimation of the SPM. Details of those improvements are available in the report appendix. All 2019 and 2020 estimates in this report reflect implementation of the revised SPM methodology.
Highlights
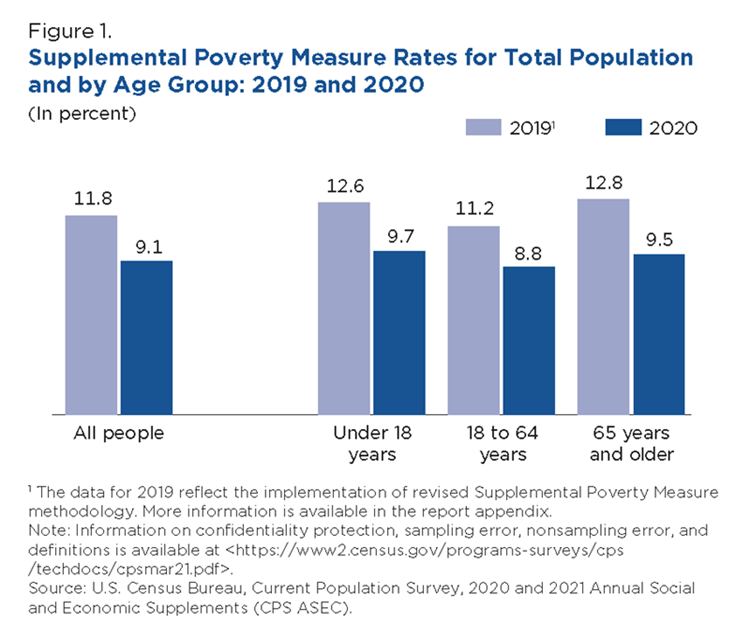
- In 2020, the overall SPM rate was 9.1 percent. This was 2.6 percentage points lower than the 2019 SPM rate of 11.8.
- SPM rates were down for all major age categories: children under age 18, adults aged 18 to 64, and adults aged 65 and older between 2019 and 2020.
- The SPM rate for 2020 was 2.3 percentage points lower than the official poverty rate of 11.4 percent. This is the first time in the history of the SPM that poverty was lower using the SPM than the official poverty rate.
- The 2020 SPM rate of 9.1 percent was the lowest rate since estimates were initially published for 2009.
- There were 11 states plus the District of Columbia for which SPM rates were higher than official poverty rates, 30 states with lower rates, and 9 states for which the differences were not statistically significant.
- Social Security continued to be the most important anti-poverty program, moving 26.5 million individuals out of poverty.
- Stimulus payments, enacted as part of economic relief legislation related to the COVID-19 pandemic, moved 11.7 million individuals out of poverty. Unemployment insurance benefits, also expanded during 2020, prevented 5.5 million individuals from falling into poverty.
Figures

Tables

Others in Series
Table
Table
Table
Others in Series
Publication
Publication
Visualization
Related Information