Census Bureau’s Characteristics of New Housing Offers a Peek Into the Nation’s New Homes This Decade
The average square footage of new homes sold in the United States increased from 2,457 in 2010 to 2,724 in 2015 but dropped in 2019 to 2,518, according to the U.S. Census Bureau’s Characteristics of New Housing.
The report is based on data collected in the Survey of Construction (SOC) which is partially funded by the Department of Housing and Urban Development (HUD). It provides national and regional details on new privately owned single-family and multifamily residential structures.
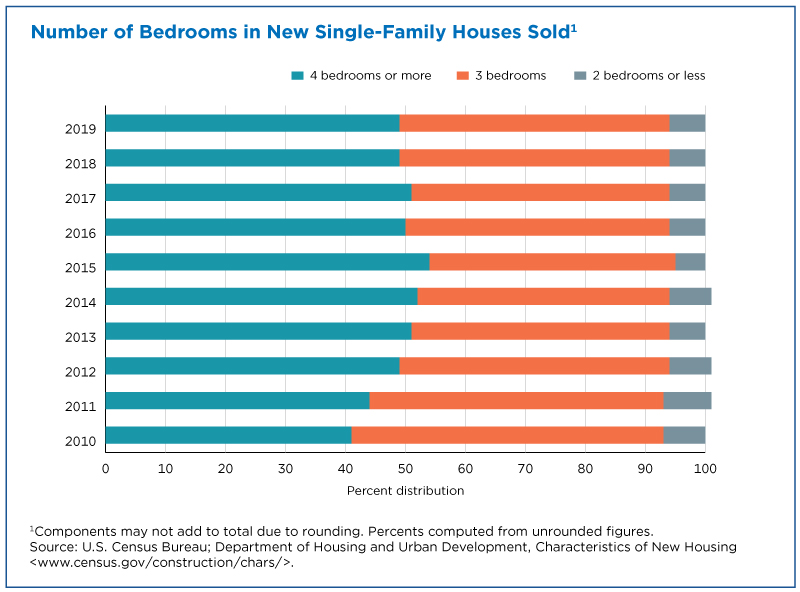
Despite the decline in average square footage, the share of homes with four bedrooms or more that were sold increased from 41% in 2010 to 49% in 2019.
Characteristics include square footage, number of bedrooms and bathrooms, types of wall material, parking, sales prices and more.
No Downsizing
Despite the decline in average square footage, the share of homes with four bedrooms or more that were sold increased from 41% in 2010 to 49% in 2019.
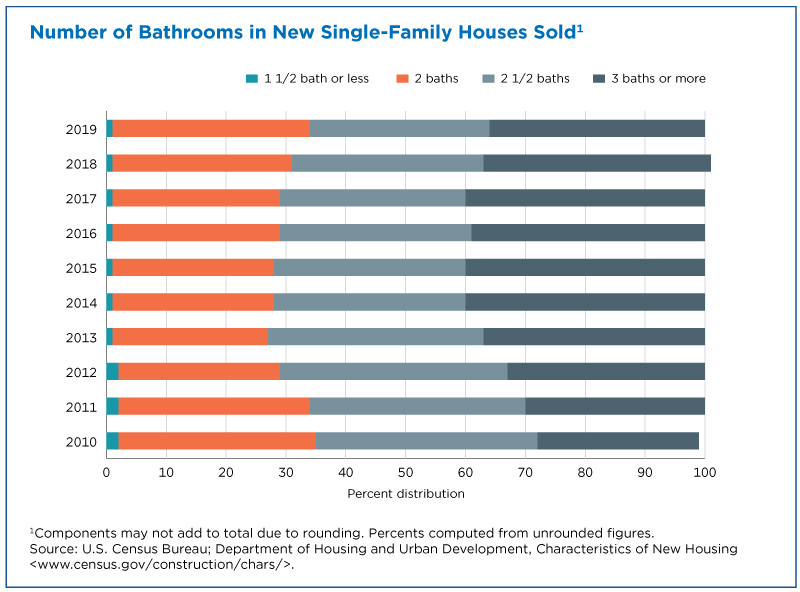
In 2010, 27% of the 323,000 new single-family homes sold in the United States had three or more bathrooms. In 2019, 36% of the 683,000 U.S. homes sold had three or more bathrooms.
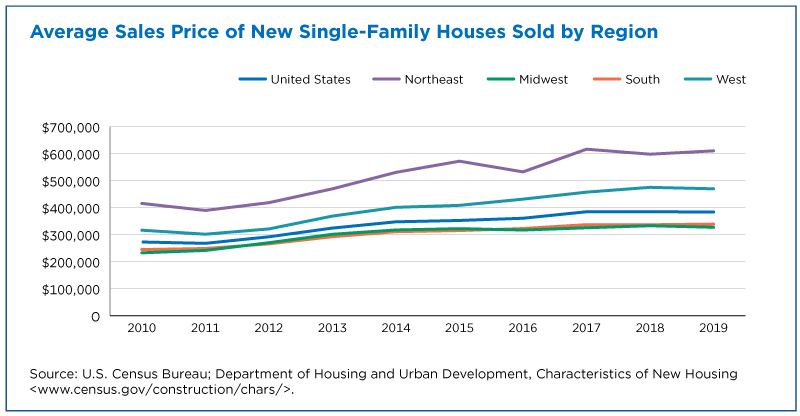
Rising Prices
The average sales price of new single-family homes sold in 2019 was $383,900, up from $272,900 in 2010. Prices are not adjusted for inflation.
In 2019, 69% of new single-family houses sold were purchased using conventional financing (and other types of financing excluding Federal Housing Administration (FHA), Veteran’s Administration (VA) or cash purchases), up from 58% in 2010.
Conventional financing, the primary way new home buyers paid for their purchases, is a mortgage loan not guaranteed by any government agency, such as the VA or FHA.

Features of New Homes
Of all the 903,000 new single-family homes completed in 2019:
- 849,000 (or 94%) had air-conditioning.
- 102,000 (11%) had two or fewer bedrooms and 386,000 (43%) had four or more bedrooms.
- 32,000 (3%) had one and one-half or fewer bathrooms and 296,000 (33%) had three or more bathrooms.
- 366,000 (41%) had a heat pump. Of these, 352,000 were air-source and 14,000 were ground-source.
- 814,000 (90%) were framed in wood and 86,000 (10%) were framed using concrete.
- 296,000 (33%) had a patio and a porch, while 71,000 (8%) had no outdoor features.
- 549,000 (61%) had no fireplace.
In 2019, 683,000 new single-family homes were sold, up 111% from 2010.

A Virtual Tour of America’s New Homes
A fun and easy way to get more details on new single-family homes is through this infographic.
Simply hover for a quick fact on completed or sold homes and click on the legend to go to the tables with the information.

Multifamily Housing
The Characteristics of New Housing report also provides information on multifamily housing.
Multifamily housing is defined as residential buildings containing units built one on top of another and those built side-by-side without a ground-to-roof wall and/or common facilities, such as attic, basement, heating system and plumbing.
There were 352,000 new multifamily units completed in the United States in 2019, compared to 155,000 in 2010. The numbers include units for sale as condominiums or cooperatives.
What new multifamily units look like:
- 149,000 (42%) had one bedroom and 40,000 (11%) had three or more bedrooms.
- 349,000 (99%) were conventional apartments and 3,000 (1%) were townhouses.
- 203,000 (58%) were in buildings with four or more floors.
- 304,000 (86%) had individual laundry facilities and 29,000 (8%) had shared laundry facilities.
- 251,000 (71%) were in buildings framed in wood and 33,000 (9%) were in steel-framed buildings.
There were 321,000 multifamily units built for rent, a 157% jump from 2010.

Note: Differences between estimates may be attributed to sampling or nonsampling error, rather than to differences in underlying economic conditions. Caution should be used in drawing conclusions from the estimates and comparisons shown. Additional information on the survey methodology, including sampling error (e.g., standard errors and relative standard errors) and nonsampling error, is available at census.gov/construction/nrc/how_the_data_are_collected/soc.html.
Philip Thompson is a special projects and outreach coordinator in the Census Bureau’s Economic Management Division.
Subscribe
Our email newsletter is sent out on the day we publish a story. Get an alert directly in your inbox to read, share and blog about our newest stories.
Contact our Public Information Office for media inquiries or interviews.
-
America Counts StoryOld Housing, New NeedsJune 22, 2020Only 10% of homes in the U.S. are aging-ready, while a quarter of all older households have trouble using some of the features of their home.
-
America Counts StoryHow Disasters Affect the Nation’s HousingMay 21, 2020Using administrative records from the Federal Emergency Management Agency, Census Bureau housing unit estimates now reflect the impact of natural disasters.
-
America Counts StorySpatial Mismatch: When Workers Can’t Get to Jobs in the SuburbsMarch 04, 2020A recent U.S. Census Bureau webinar explored the challenge of job sprawl in the Dallas-Fort Worth area, using Local Employment Household Dynamics data sets.
-
PopulationMovin’ Out: More Growth on Outer Edges of Major CitiesMay 14, 2026New 2025 Census Bureau population estimates for cities and towns show population growth farther from city centers, but not for every city.
-
Small BusinessCensus Bureau Data Tell the Small Business StoryMay 04, 2026The 63rd Annual Small Business Week recognizes small businesses’ contribution to the nation’s economy.
-
Families and Living ArrangementsOver a Third of Partners in Opposite-Sex Couples Were the Same AgeApril 27, 2026A new interactive data visualization explores characteristics of opposite-sex married and unmarried couples who lived together in 2025.
-
PopulationEight of the Nation’s Top 15 Last Names Stayed the Same Since 1790April 14, 2026Newly released names data from the 2020 Census show which first and last names are the most popular across the nation.