Girls Take Lessons, Join Clubs More Often Than Boys But Boys Play More Sports
Children are engaging in more extracurricular activities like lessons and sports than they did more than two decades ago, according to the U.S. Census Bureau.
A Child's Day: Historical Tables and Figures tracks children’s involvement in extracurricular activities by sex and poverty levels from 1998 to 2020.
Extracurricular activities are associated with a range of positive outcomes for children and adolescents including higher academic performance, more positive academic perspectives and higher academic aspirations.
Research has shown that participating in such activities can help develop social skills, boost self-esteem and resiliency and lower levels of risky behaviors. Additionally, researchers found that more involvement in those activities give youth a chance to develop social skills and discover their own interests.
Some of the trends discussed here are shown in the figures below, and the others can be found in the table and graph package. Only comparisons of data for years 1998 and 2020 were tested for statistical significance.
In contrast to sports, girls joined clubs in higher proportions than boys. In 2020, 29% of girls and 24% of boys were involved in clubs.
Extracurricular Activities: Sports
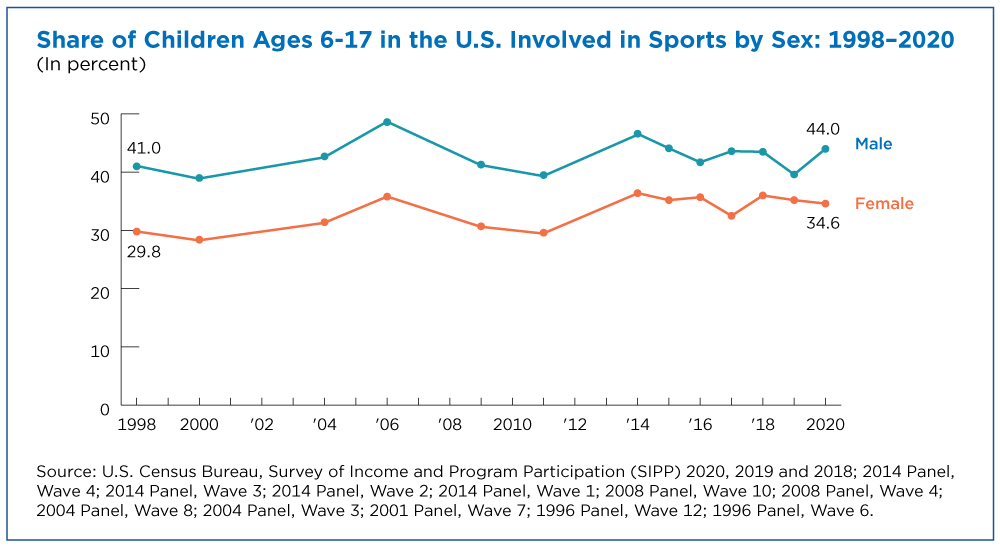
The proportion of boys and girls playing on a sports team increased between 1998 and 2020, despite some fluctuations during that period. For example, 44% of boys were on a sports team in 2020 compared with 41% in 1998.
Sports have consistently been a more popular activity among boys than girls. In 2020, 44% of boys participated in sports-related activities while about one-third (35%) of girls did so. The pattern was similar in 1998, when 41% of boys played sports compared with 30% of girls.
Extracurricular Activities: Clubs and Lessons
In contrast to sports, girls joined clubs in higher proportions than boys. In 2020, 29% of girls and 24% of boys were involved in clubs.
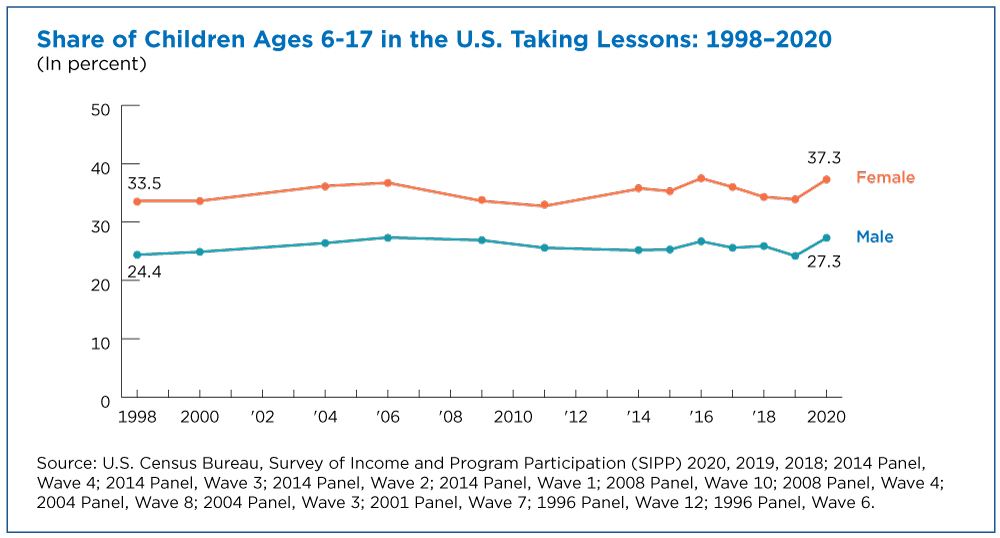
Girls also participated more often in music, dance, language or other lessons compared to boys.
By 2020, 37% of girls and 27% of boys took lessons, up for both girls and boys from 33.5% and 24%, respectively, in 1998.
Parents have relied more on private tutoring since the start of the COVID-19 pandemic in early 2020 partly because of school closures. This jump in private lessons may have impacted the Census Bureau’s Survey of Income and Program Participation (SIPP) 2020 estimates, which possibly included extracurricular subjects.
Nonresponse bias may also have affected SIPP results, meaning that the characteristics of those who responded were different than those who did not respond.
Over more than two decades, however, participation in clubs like the Scouts and religious groups slipped. In 1998, for example, 38% of girls participated in clubs compared to only 29% in 2020.
Extracurricular Activities by Poverty Level
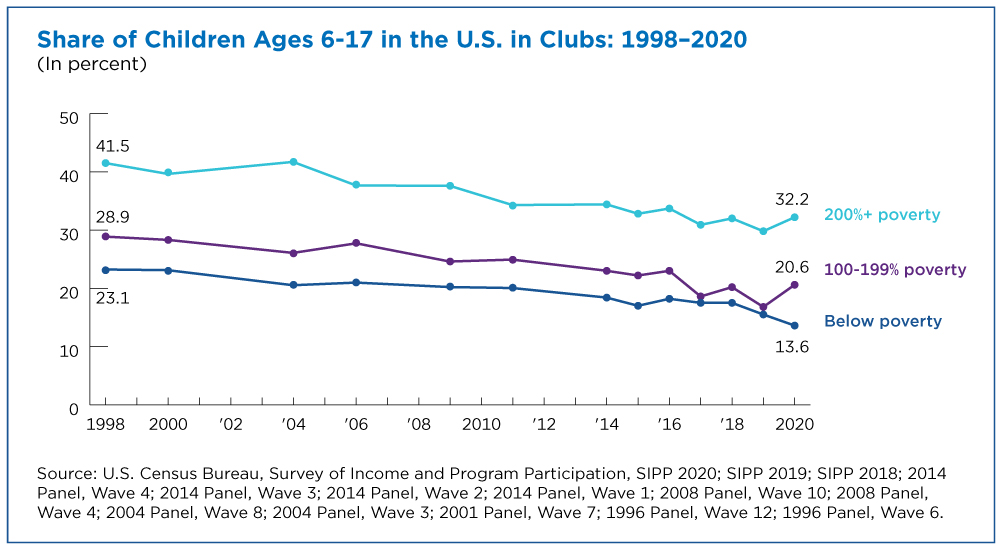
Club participation decreased among all children regardless of the family income-to-poverty ratio. But participation in sports and lessons only went up among children in families at 200% or higher of the poverty threshold.
The ratio of family income to poverty is measured by considering a family’s total income and the poverty threshold that corresponds to the family’s size and composition. If a family's total income is less than the family's poverty threshold, that family and each of its members are considered to be in poverty.
For the purposes of this story, the ratio has been classified into three groups: an income-to-poverty ratio less than 100% (considered to be in poverty), 100%-199%, and 200% or higher.
Poverty influences children’s involvement in extracurricular activities. Many activities require parental time and financial resources for fees, transportation and equipment.
Not surprisingly, children in households with more financial resources participated in more activities: 47% of those in households at or over 200% of poverty engaged in sports in 2020, up from 43% in 1998.
There was no statistical change in sports participation between these years among children in households below poverty (23%) or at 100-199% of poverty (about 28%).
The trend was similar among children taking lessons. The only group with statistically higher proportions taking lessons in 2020 (38%) than in 1998 (35%) were those in households at or over 200% of poverty.
Club participation steadily decreased regardless of household poverty level. How it declined from 1998 to 2020:
- From 23% to 14% among children in households below the poverty threshold.
- From 29% to 21% among children in households at 100-199% of the poverty level.
- From 41.5% to 32% among children in households at or over 200% poverty.
A Child's Day: Historical Tables and Figures
Earlier this year the Census Bureau released a set of tables and figures including data on child well-being measures collected by the Survey of Income and Program Participation between 1998 and 2020.
This product includes four sets of tables and four sets of graphs that show U.S. national level estimates of school-aged children (ages 6 to 17) by sex and poverty of such things as their participation in extracurricular activities and whether they’ve ever been expelled, suspended or repeated a grade.
SIPP and Child Well-Being
The SIPP collects information on child well-being, including details on children’s extracurricular activities and school performance.
Reference parents (usually the mother) are asked if children participated in extracurricular activities like sports, clubs or lessons after school or on weekends. Information on whether a child has ever repeated a grade and been suspended or expelled is also collected.
About the SIPP
The SIPP is a nationally representative longitudinal survey administered by the Census Bureau that provides comprehensive information on the dynamics of income, employment, household composition and government program participation.
For more information, visit the SIPP page. For technical documentation and more information about SIPP data quality, visit the SIPP Technical Documentation page. The estimates presented here are subject to sampling and nonsampling error.
Both SIPP 2020 and SIPP 2019 faced different data collection issues that resulted in nonresponse bias which may have shaped the patterns of extracurricular activities.
Yerís H. Mayol-García is a statistician in the Census Bureau’s Fertility and Family Statistics Branch.
Related Statistics
-
Stats for StoriesNational Child's Day: November 20, 2023In 2021, the majority (71%) of America’s 72.3M children under 18 lived with two parents and the next largest share (20.9%) lived with their mothers only.
-
Stats for StoriesBack to School: August 2025It’s back-to-school season and an estimated 54.1 million K-12 students and 5.7 million teachers are set to return to the classroom this fall.
-
Survey of Income and Program Participation (SIPP)Provides comprehensive information on the dynamics of income, employment, household composition, and government program participation.
Subscribe
Our email newsletter is sent out on the day we publish a story. Get an alert directly in your inbox to read, share and blog about our newest stories.
Contact our Public Information Office for media inquiries or interviews.
-
America Counts StoryChildren Experienced Episodic Poverty at Higher Rate Than AdultsAugust 30, 2021A recent U.S. Census Bureau report explores episodic and chronic poverty rates among children, working-age adults and seniors from 2013-2016.
-
America Counts StoryChildren in Poverty Less Likely to Engage in Sports, Gifted ProgramsSeptember 23, 2020New U.S. Census Bureau survey highlights the impact that poverty has on school-aged children’s involvement in extracurricular activities.
-
America Counts StoryU.S. Childhood Disability Rate Up in 2019 From 2008March 25, 2021A new Census Bureau brief shows that childhood disability rates were highest among American Indian and Alaska Native children and those in poverty.
-
IncomeHow Income Varies by Race and GeographyJanuary 29, 2026Median income of non-Hispanic White households declined in five states over the past 15 years: Alaska, Connecticut, Louisiana, Nevada, and New Mexico.
-
HousingRental Costs Up, Mortgages Stayed FlatJanuary 29, 2026Newly Released American Community Survey compares 2020-2024 and 2015-2019 housing costs by county.
-
HousingShare of Owner-Occupied, Mortgage-Free Homes Up in 2024January 29, 2026The share of U.S. homeowners without a mortgage was higher in 2024 than a decade earlier nationwide and in every state, though not all counties saw increases.
-
PopulationU.S. Population Growth Slowest Since COVID-19 PandemicJanuary 27, 2026The decline in international migration was felt across the states, though its impact varied.


