Cost of Improving and Maintaining Older Homes Higher for New Owners
Initial costs of upkeep were higher for new owners of older homes than for those who had lived in their homes for at least 10 years, according to recently released Census Bureau data.
About 61% of owners of older homes started a home improvement project between 2019 and 2021, spending a median of $4,100 on all their home improvement projects during that time.
The 2021 American Housing Survey (AHS) shows that in 2021, the median age of all owned homes was 41 years. Older homes — those built before 1950 — made up about 17% of homes and their owners spent a median of $1,800 a year on upkeep.
Upkeep includes both home improvement projects such as remodeling a kitchen or installing a security system and routine maintenance such as painting, plumbing, roofing and other minor repairs.
The AHS asks homeowners how much they spent on home improvements over the previous two years, or since they moved in if they had lived in the home less than two years.
Owners of older homes who had moved in within the past two years tended to spend more on overall upkeep. These new owners spent a median of $3,900 per year, while longtime owners who had lived in older homes for at least 10 years spent about $1,500 annually.
To estimate annual spending, the amount reported was averaged over the time the owner lived in the home between 2019 and 2021:
- About 61% of owners of older homes started a home improvement project between 2019 and 2021, spending a median of $4,100 on all their home improvement projects during that time.
- Median annual spending on maintenance alone was around $540 for owners of older homes.
Types of Home Improvement
Regardless of the home’s age, the most common type of projects were interior improvements. Nationwide, 47% of homeowners undertook such projects. The percentage of owners of older homes with interior projects did not differ from this national percentage.
Among owners of older homes, 59% of new owners who had moved in within the last two years did interior projects, compared to 46% of longtime owners who had lived in the home at least 10 years.
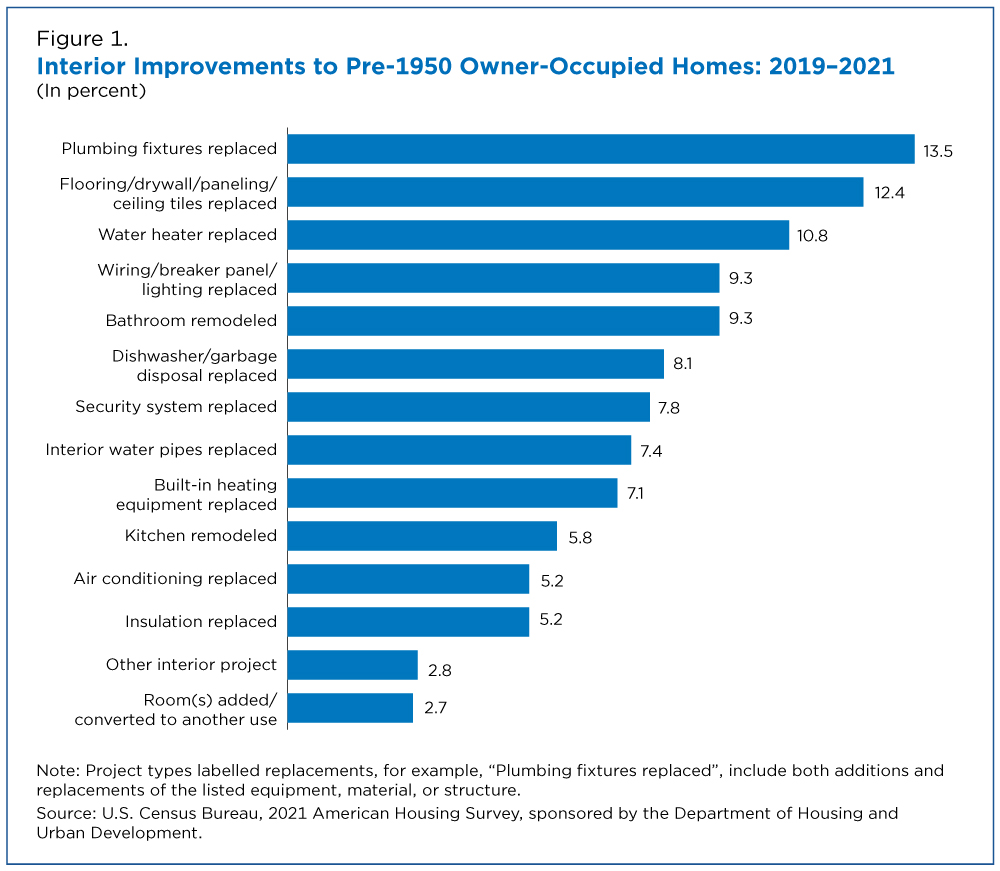
The most common types of interior improvements in older homes were additions or replacements of plumbing fixtures; flooring, drywall, paneling or ceiling tiles; and water heaters.
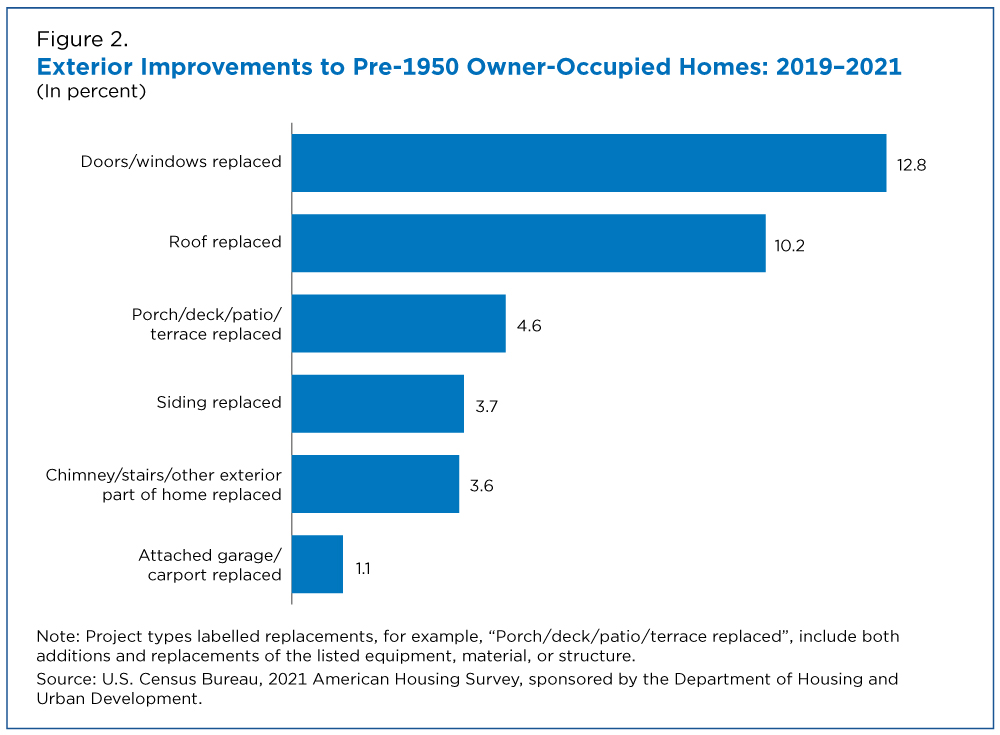
About 27% of owners of older homes made exterior improvements. The most common types of projects were window and door replacements; replacing the roof; and adding or replacing a porch, deck, patio or terrace.
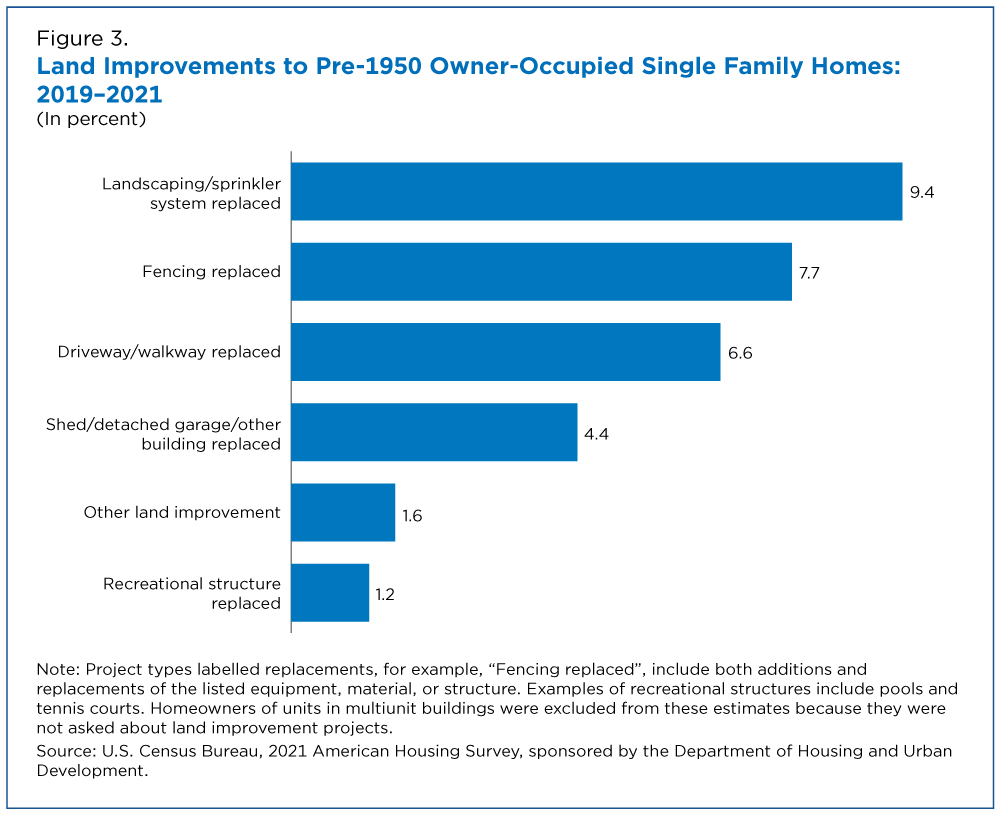
About 21% of owners of older homes made land improvements, which was not statistically different from the share of all homeowners.
The top land improvement projects among owners of older homes were landscaping; adding or replacing fencing; and adding or replacing a driveway or walkway.
New owners of older homes were more likely (32%) than longtime owners (18%) to undertake land improvements.
Spending by Home Size
Older homes tend to be smaller, with a median of 1,290 square feet of living space compared to around 1,500 square feet for all homes.
Owners of older homes spent a median of $200 per 500 square feet of living space on routine maintenance annually.
Those who undertook at least one home improvement project spent a median of about $700 for each 500 square feet of living space on their projects.
Spending by Home Value
More than half of owners of older homes spent less than 1% of their home’s value annually on home improvement and maintenance.
New owners spent more than longtime owners: a median of 1.5% of the home’s value, compared to 0.6%.
Characteristics of Owners of Older Homes in 2021
The median age of owners of older homes was 58 and 26% of their households had children.
Nationwide, 15% of homeowners lived in an older home. For householders who were Black, Hispanic, White, or Two or More Races, the percentage of homeowners in an older home was not statistically different from the national percentage.
About 10% of homes owned by Asian American and Pacific Islander (AAPI) householders and 7% of homes owned by American Indian and Alaska Native (AIAN) householders were built before 1950.
More Housing Data
The AHS Table Creator has further information on home improvement from the 2021 AHS and on topics such as maintenance needs, physical characteristics of homes, neighborhood features and household demographics.
The AHS is conducted by the Census Bureau and sponsored by the U.S. Department of Housing and Urban Development. It provides up-to-date information on the quality and cost of housing in the United States and major metropolitan areas. The 2021 American Housing Survey page provides related definitions and information on sampling and nonsampling error.
All comparative statements in this article have undergone statistical testing and, unless otherwise noted, are statistically significant at the 10% significance level.
Related Statistics
-
Stats for StoriesAmerican Housing Month: June 2023The 2021 American Community Survey counted 142.15M housing units, up 3.61M from 2018, and up 10.36M from 131.79M in 2010.
-
American Housing Survey (AHS)The AHS is sponsored by the Department of Housing and Urban Development (HUD) and conducted by the U.S. Census Bureau.
-
America Counts: Stories About HousingExplore various America Counts stories on the topic of housing.
Subscribe
Our email newsletter is sent out on the day we publish a story. Get an alert directly in your inbox to read, share and blog about our newest stories.
Contact our Public Information Office for media inquiries or interviews.
-
HousingSee a Vacant Home? It May Not be For Sale or RentMay 25, 2023The largest category of vacant housing is seasonal housing, from beachfront homes to part-time residences.
-
HousingOwning or Renting the American DreamJune 29, 2023In recognition of American Housing Month and National Homeownership Month, we explore housing data from the U.S. Census Bureau.
-
HousingYounger Householders Drove Rebound in U.S. HomeownershipJuly 25, 2023Housing Vacancy Survey found homeownership rates, especially among those age 44 and younger, improved in all regions.
-
IncomeHow Income Varies by Race and GeographyJanuary 29, 2026Median income of non-Hispanic White households declined in five states over the past 15 years: Alaska, Connecticut, Louisiana, Nevada, and New Mexico.
-
HousingRental Costs Up, Mortgages Stayed FlatJanuary 29, 2026Newly Released American Community Survey compares 2020-2024 and 2015-2019 housing costs by county.
-
HousingShare of Owner-Occupied, Mortgage-Free Homes Up in 2024January 29, 2026The share of U.S. homeowners without a mortgage was higher in 2024 than a decade earlier nationwide and in every state, though not all counties saw increases.
-
PopulationU.S. Population Growth Slowest Since COVID-19 PandemicJanuary 27, 2026The decline in international migration was felt across the states, though its impact varied.


