
The Annual Integrated Economic Survey (AIES) Offers a Streamlined Approach to Business Statistics and Visualizations
It doesn’t matter whether you’re a policymaker, a business leader or just trying to stay informed — our nation’s economy is complex.
Tracking online trends, judging local market conditions and gauging the economic health of an industry are easier with the right tools.
And now, you can access business revenue, payroll and employment data from the Annual Integrated Economic Survey (AIES) in one interactive visualization tool for the first time.
By bringing these data together in one place, the AIES enables data users to examine the economy with a depth of detail previously unavailable.
The AIES is the U.S. Census Bureau’s most comprehensive source of annual national and subnational economic data.
Combining seven previously administered business surveys and adding new levels of geographic detail, “the AIES provides insights that will inform decisions across the public and private sectors,” says Lisa Donaldson, assistant director for economic programs at the Census Bureau.
What Is the AIES?
The AIES gives a yearly snapshot of businesses by collecting information measures of their economic activity such as revenue, expenses and other industry-specific operations.
By bringing these data together in one place, the AIES enables data users to examine the economy with a depth of detail previously unavailable.
The AIES offers several key advantages over the surveys it replaced:
- It reduces burden, improves operational efficiency and enhances data quality.
- It provides annual data spanning 19 sectors in a single, unified location. Previously, users had to compile information from multiple sources to get a comprehensive view of the employer economy.
- It offers data at the regional, divisional and state levels for select sectors.
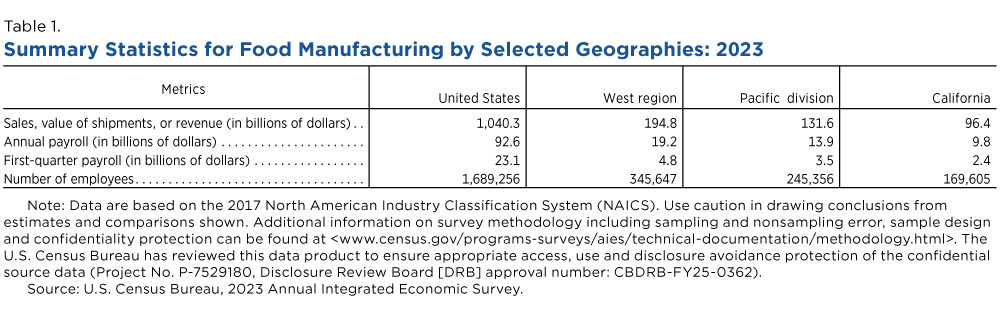
For example, data users interested in finding statistics for the Food Manufacturing subsector can now compare summary statistics at various geographies (Table 1).
A New Visualization Tool
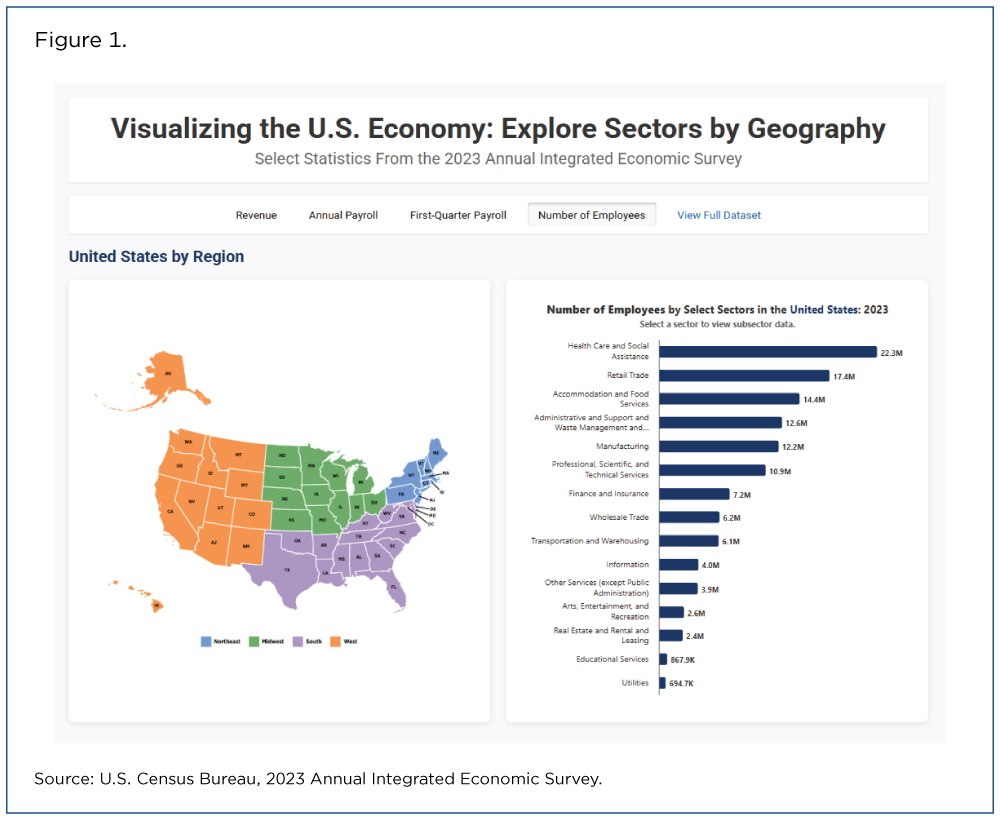
The AIES interactive visualization enables users to explore select North American Industry Classification System (NAICS) sector and subsector statistics by region (Figure 1).
Take the Food Manufacturing subsector again as an example. Users can view revenue and other summary statistic estimates across all regions of the country.
Data Access
Visit the AIES data page to explore the full range of AIES data. All available data are organized into multiple hyperlinked tables that make it easy to find needed information across a broad set of economic statistics. The available data and access methods include:
AIES Data Types
- Summary Statistics (Sales, Value of Shipments or Revenue, Annual Payroll, First-Quarter Payroll, Employment, Production Workers, Inventories, Expenses).
- Detailed Industry Expenses.
- Inventory Valuation Statistics.
- Detailed Revenue Products by Industry Statistics.
- Statistics by Customer Type.
- E-Commerce Statistics.
- Experimental Data Releases.
AIES Data Access
- data.census.gov.
- File Transfer Protocol (FTP) Files.
- Application Programming Interface (API).
Other Data Visualizations
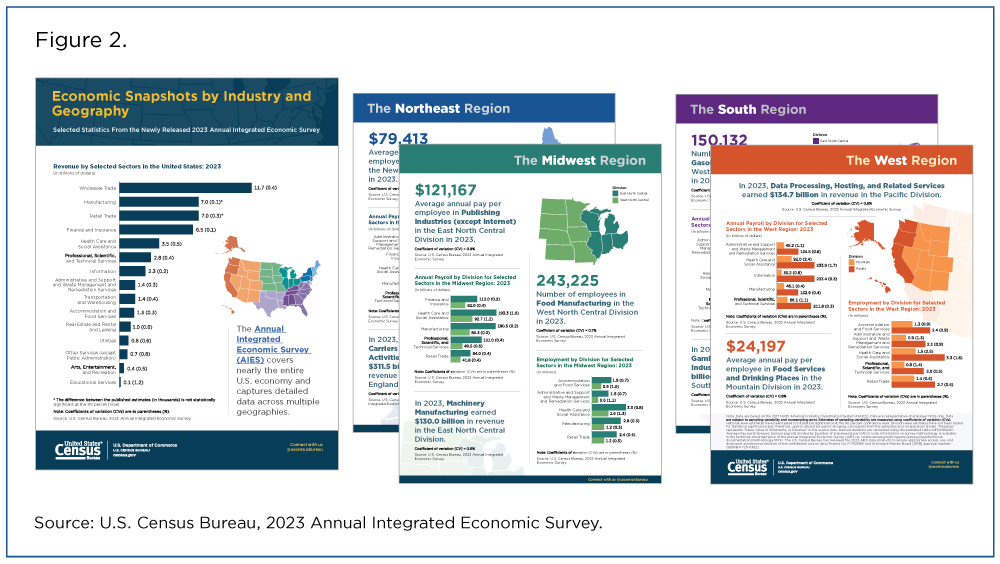
In addition to the interactive visualization, new static data visualizations are also available for the 2023 AIES data.
Economic Snapshots by Industry and Geography showcase national, regional and division-level data for select sectors in the United States (Figure 2) and give users a glimpse of the kind of data available in an easy-to-consume format.
More information on the AIES is available on the AIES webpage and in our webinar, the February 2026 press release and a Random Samplings blog post.
Keep a lookout for 2024 AIES summary statistics (data collected in 2025) set to be released in September.
Related Statistics
Subscribe
Our email newsletter is sent out on the day we publish a story. Get an alert directly in your inbox to read, share and blog about our newest stories.
Contact our Public Information Office for media inquiries or interviews.
Related America Counts Stories
-
Business and EconomyEconomic Census Geographic Area Statistics Data Now AvailableApril 07, 2025A new data visualization based on the 2022 Economic Census shows the changing business landscape of 19 economic sectors across the United States.
-
Business and EconomyBig Improvements to the Annual Integrated Economic Survey (AIES)March 26, 2025The Census Bureau is making several changes and enhancements to capture 2024 economic data based on feedback from last year’s survey.
-
Business and EconomyExploring Two “First Look” Economic DatasetsJune 06, 2024Early data from the 2022 Economic Census and 2023 Annual Business Survey offer a glimpse of the number of employer businesses in the United States.
-
Emergency PreparednessTornado Activity Shifts East — Heightening Risks in the SouthOctober 07, 2026Census data can help vulnerable communities that have a concentration of mobile homes cope with more frequent tornado activity over a longer season.
-
Families and Living ArrangementsU.S. Parents Gave $26.6 Billion to Their Adult Children in 2024September 30, 2026About 2.6 million parents provided financial support to 3.7 million children age 21 and over who did not live at home.
-
Business and EconomyAmerican Manufacturing: A History in Census DataSeptember 28, 2026On the 15th anniversary of Manufacturing Day, we celebrate the sector’s contribution to the U.S. economy.
-
EducationBeyond Diplomas: Nondegree Credentials Linked to Higher EarningsSeptember 22, 2026High school graduates and even those with college degrees earned more with nondegree credentials targeting specific work skills.