States With Highest Poverty Rates Clustered in the South
The national official poverty rate of 10.2% was 2.9 percentage points lower than the Supplemental Poverty Measure (SPM) rate of 13.1% in 2025, according to the U.S. Census Bureau’s Poverty in the United States: 2025 report released today.
Estimates from the Current Population Survey Annual Social and Economic Supplement (CPS ASEC) show that the SPM, which includes government benefits and deductions, also topped the official rate when using three-year averages.
All but one (New Mexico) of the 11 states with official+ poverty rates significantly above the national rate of 10.7% were in the South.
From 2023 to 2025, the national SPM rate was 13.0% and the official rate was 10.7%. SPM rates were higher than official poverty rates in 26 states and the District of Columbia, lower in five states and not significantly different in the remaining 19.
The Census Bureau recommends using three-year averages for state-level analyses based on the CPS ASEC due to sample size.
The version of the official poverty rate used in this article (hereafter official+) includes unrelated individuals under age 15 to allow direct comparisons to the SPM.
Comparing Official⁺ Poverty and the SPM
The official poverty measure defines poverty by comparing pre-tax money income — gross (before taxes) income from things like earnings, Social Security, and pensions — to a threshold based on family size. Families or individuals are considered to be in poverty if their income falls below that threshold.
The SPM is a broader measure of poverty. It takes into account income plus the value of benefits from government programs designed to assist low-income families (like SNAP and housing assistance). It then subtracts medical, work and other necessary expenses.
It also accounts for state and federal taxes, adding things like tax refunds and subtracting taxes paid. Another difference: SPM thresholds vary by geography and housing tenure (renters, owners, and those without rent or a mortgage) while official poverty thresholds are the same for the whole country.
These differences led to gaps between the SPM and official⁺ poverty rates, but not consistently across the country.
In many states, the two poverty measures were not statistically different, but in others state-level variation in housing cost, housing tenure, taxes and medical expenses can make the SPM rate higher or lower than the official+.
Poverty Rates by State
The CPS ASEC is the official source of national poverty estimates. The Census Bureau recommends using three-year averages for state-level estimates to increase statistical reliability.
The three-year average national SPM rate for 2023 to 2025 was 13.0%, while the official+ rate was 10.7%.
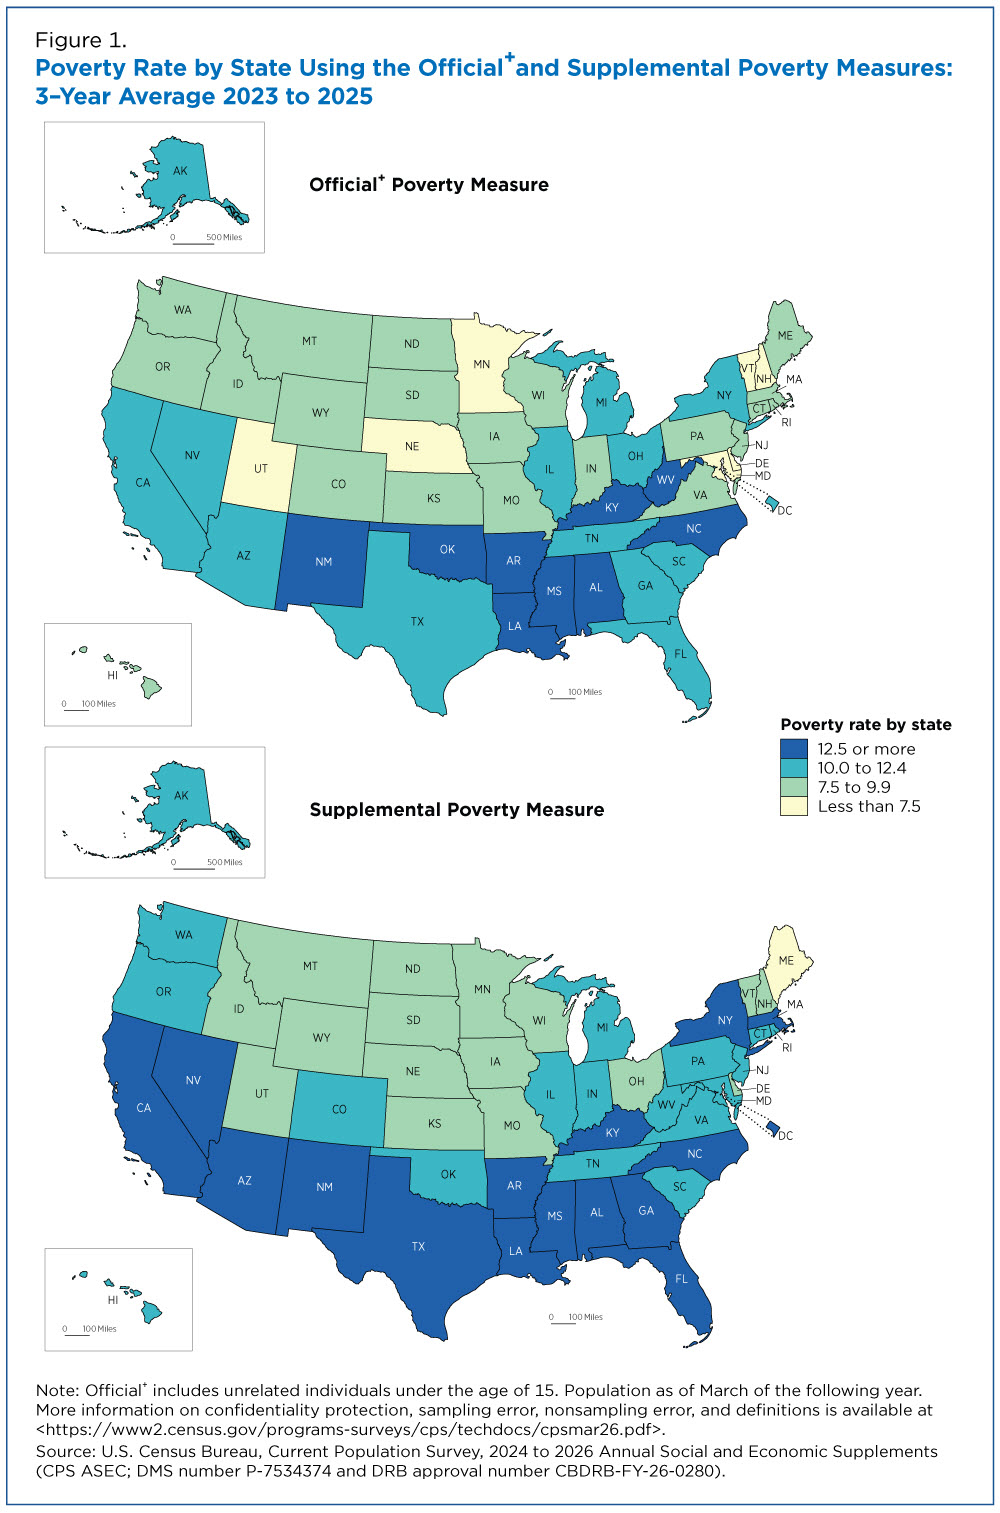
The top panel of Figure 1 shows the three-year average official+ and SPM rates by state. From 2023 to 2025, Louisiana (19.6%) and Mississippi (17.6%) had among the highest official+ poverty rates. New Hampshire (5.4%) had the lowest.
States with the highest official+ poverty rates were clustered in the South.
All but one (New Mexico) of the 11 states with official+ poverty rates significantly above the national rate of 10.7% were in the South: Alabama, Arkansas, Georgia, Kentucky, Louisiana, Mississippi, North Carolina, Oklahoma, Texas and West Viriginia. The District of Columbia’s poverty rate was also significantly above the national rate.
The bottom panel of Figure 1 shows the three-year average SPM rate by state. From 2023 to 2025, Louisiana (19.0%) and California (17.8%) had among the highest SPM rates, while New Hampshire (8.0%), South Dakota (8.0%), Minnesota (7.9%), Nebraska (7.5%) and Maine (6.4%) had among the lowest.
During the same period, eight states and the District of Columbia had SPM rates significantly above the national rate. Of those, five — Alabama, Louisiana, Mississippi, Texas and the District of Columbia — also had official+ rates significantly above the national rate.
California, Florida, New York and Nevada had SPM rates above the national rate, but their official+ poverty rates were not statistically different from or were below it.
Figure 2 maps the differences between the two measures from 2023 to 2025.
The SPM rate was significantly lower than the official+ rate in five states: Maine, New Mexico, Ohio, Oklahoma and West Virginia.
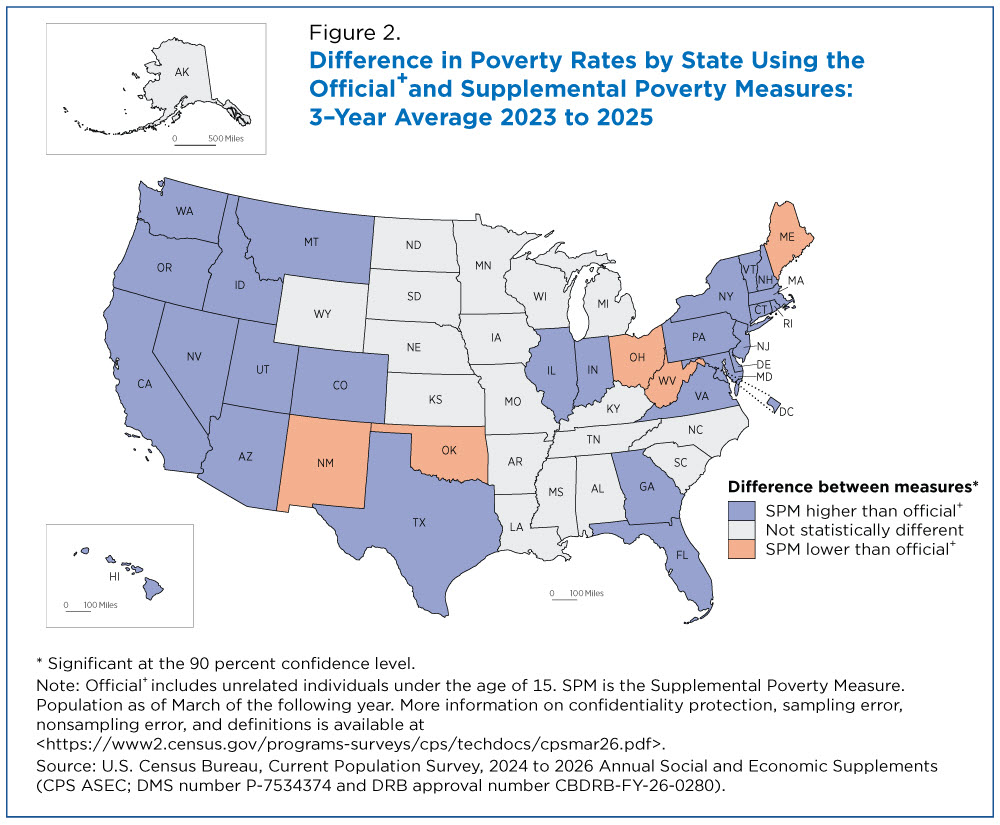
The SPM rate was significantly higher than the official+ rate in the District of Columbia and 26 states: Arizona, California, Colorado, Connecticut, Delaware, Florida, Georgia, Hawaii, Idaho, Illinois, Indiana, Maryland, Massachusetts, Montana, Nevada, New Hampshire, New Jersey, New York, Oregon, Pennsylvania, Rhode Island, Texas, Utah, Vermont, Virginia and Washington.
The two measures were not statistically different in the remaining 19 states: Alabama, Alaska, Arkansas, Iowa, Kansas, Kentucky, Louisiana, Michigan, Minnesota, Mississippi, Missouri, Nebraska, North Carolina, North Dakota, South Carolina, South Dakota, Tennessee, Wisconsin and Wyoming.
About the CPS ASEC
CPS ASEC data are released annually in September and are the source for the official poverty measure and the SPM. The CPS ASEC collects data on income, health insurance, government benefits, migration and childcare.
The Poverty in the United States: 2025 report and accompanying data tables contain more information on poverty estimates and provide poverty estimates for several demographic groups and family types.
The technical documentation page includes information on confidentiality protection, methodology, and sampling and nonsampling error. All comparative statements have undergone statistical testing and are statistically significant at the 90% confidence level unless otherwise noted.
Related Statistics
Subscribe
Our email newsletter is sent out on the day we publish a story. Get an alert directly in your inbox to read, share and blog about our newest stories.
Contact our Public Information Office for media inquiries or interviews.
Related America Counts Stories
-
IncomeU.S. Real Median Household Income Reached Record High in 2025September 15, 2026Real income increased at the top but not the bottom of the income distribution from 2024 to 2025.
-
Income and PovertyHispanic Poverty Rate Reached Historic Low in 2025September 15, 2026The Hispanic population’s poverty rate fell to 13.9%, down 1.2 percentage points from 2024 — still disproportionately high despite being the lowest on record.
-
Health InsuranceMedicaid Coverage Declined in 2025 for Second Year in a RowSeptember 15, 2026Changes in policy, funding, eligibility and enrollment processes that began in 2020 contributed to decline in Medicaid coverage.
-
Families and Living ArrangementsU.S. Parents Gave $26.6 Billion to Their Adult Children in 2024September 30, 2026About 2.6 million parents provided financial support to 3.7 million children age 21 and over who did not live at home.
-
Business and EconomyAmerican Manufacturing: A History in Census DataSeptember 28, 2026On the 15th anniversary of Manufacturing Day, we celebrate the sector’s contribution to the U.S. economy.
-
EducationBeyond Diplomas: Nondegree Credentials Linked to Higher EarningsSeptember 22, 2026High school graduates and even those with college degrees earned more with nondegree credentials targeting specific work skills.
-
Emergency PreparednessCalm Atlantic Hurricane Season Could Mean Active One in the PacificSeptember 17, 2026Census Bureau data tools can help communities prepare for and recover from hurricanes and other disasters wherever they are.