
Census Bureau Data Highlight Continued Importance of Nation’s Storied Manufacturing Industry
In 1810, during the early stages of the Industrial Revolution and two decades after the first U.S. decennial population count, U.S. Marshals were tasked with collecting Manufacturing data as part of their census-taking duties.
They asked questions on 25 categories of manufactured products and more than 200 types of goods, from tobacco to food.
According to the 2024 Annual Integrated Economic Survey, manufacturing generated $7.0 trillion in total revenue.
More than two centuries later, multiple Census Bureau surveys collect data on manufacturing companies and their products.
We look back at the nation’s history of manufacturing through Census Bureau data in recognition of the 15th anniversary of Manufacturing Day on Oct. 2.
The Census Bureau Manufacturing Week page highlights the latest data on the industry.
History of Capturing U.S. Manufacturing Data
To best respond to lessons learned from the 1810 and 1820 Censuses and enhance economic measurement, manufacturing data was not collected in 1830. When collection resumed with the 1840 Census, questions on mining, fisheries, and agriculture were added.
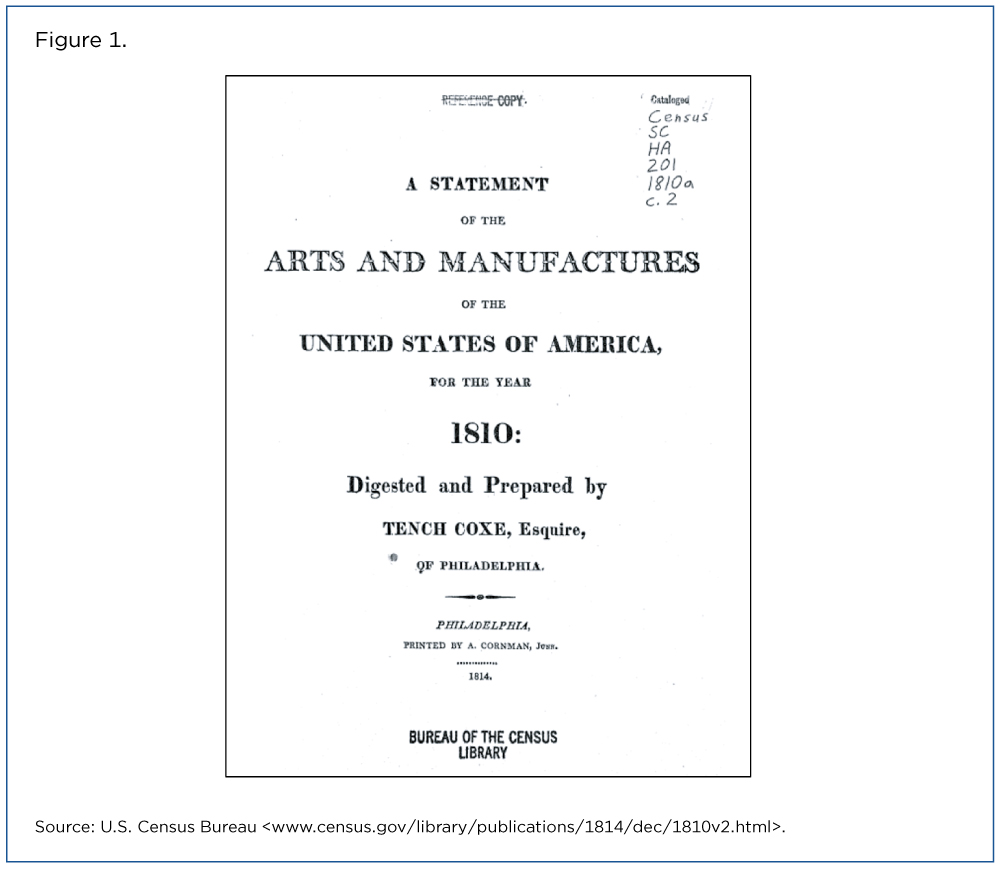
In 1902, Congress established the permanent Census Bureau and directed that, in addition to the once-a-decade population count, a Census of Manufactures be taken every five years.
The 1905 Census of Manufactures marked the first time a census of any kind was taken separately from the decennial population census.
The First Economic Census
The first Census of Business took place in 1930, covering Retail Trade, Wholesale Trade, and Construction industries. It soon broadened to include some service trades like carpentry and healthcare.
The 1954 Economic Census was the first to fully integrate questions on various kinds of business and provide comparable data across economic sectors (Figure 2).
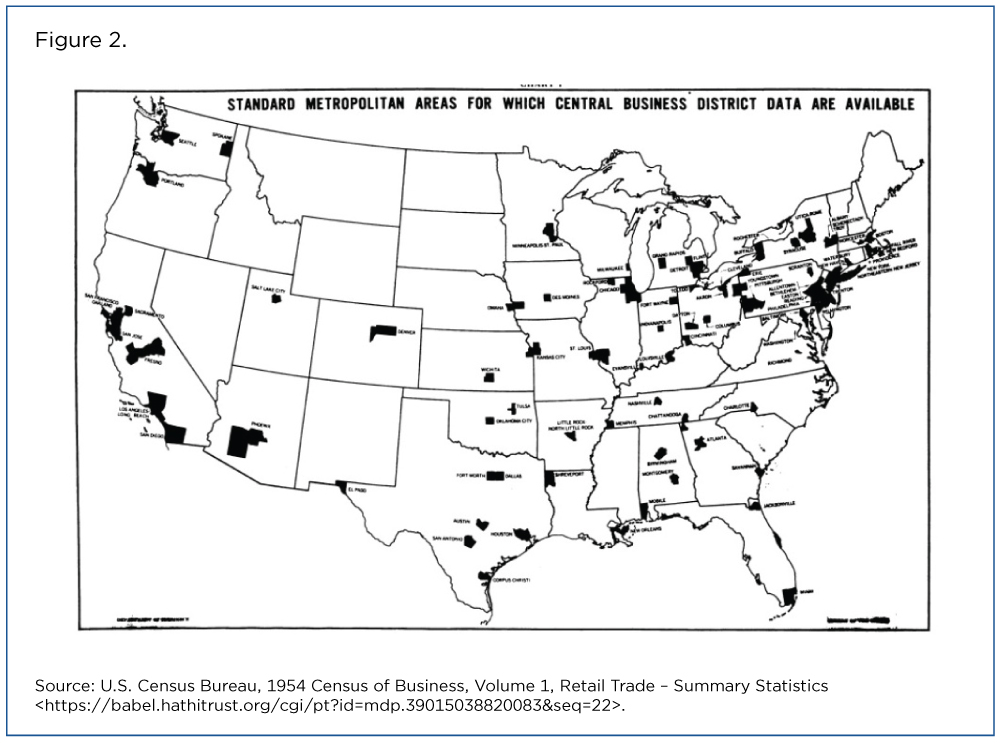
The range of industries covered in the economic census continued to expand. For example, the inclusion of construction industries began in 1967, and the scope of service industries continued to grow.
In 1987 the economic census expanded to include business establishments (a single physical location of a business) engaged in various transportation industries, paralleling data on establishments in other sectors.
The last major expansion of the economic census occurred in 1992, when the Census Bureau added Transportation and Warehousing; Finance and Insurance; Real Estate and Rental and Leasing; Information; and Utilities — industries that today account for more than 20% of U.S. Gross Domestic Product (GDP).
The 1997 Economic Census was the first major statistical report to use the North American Industry Classification System (NAICS). Developed jointly by the United States, Canada and Mexico, NAICS replaced the older Standard Industrial Classification (SIC) system to allow greater comparability with international statistics.
The current economic census, together with the separately conducted censuses of agriculture and governments, covers virtually the entire economy.
Historical Data Shows Growth by Industry
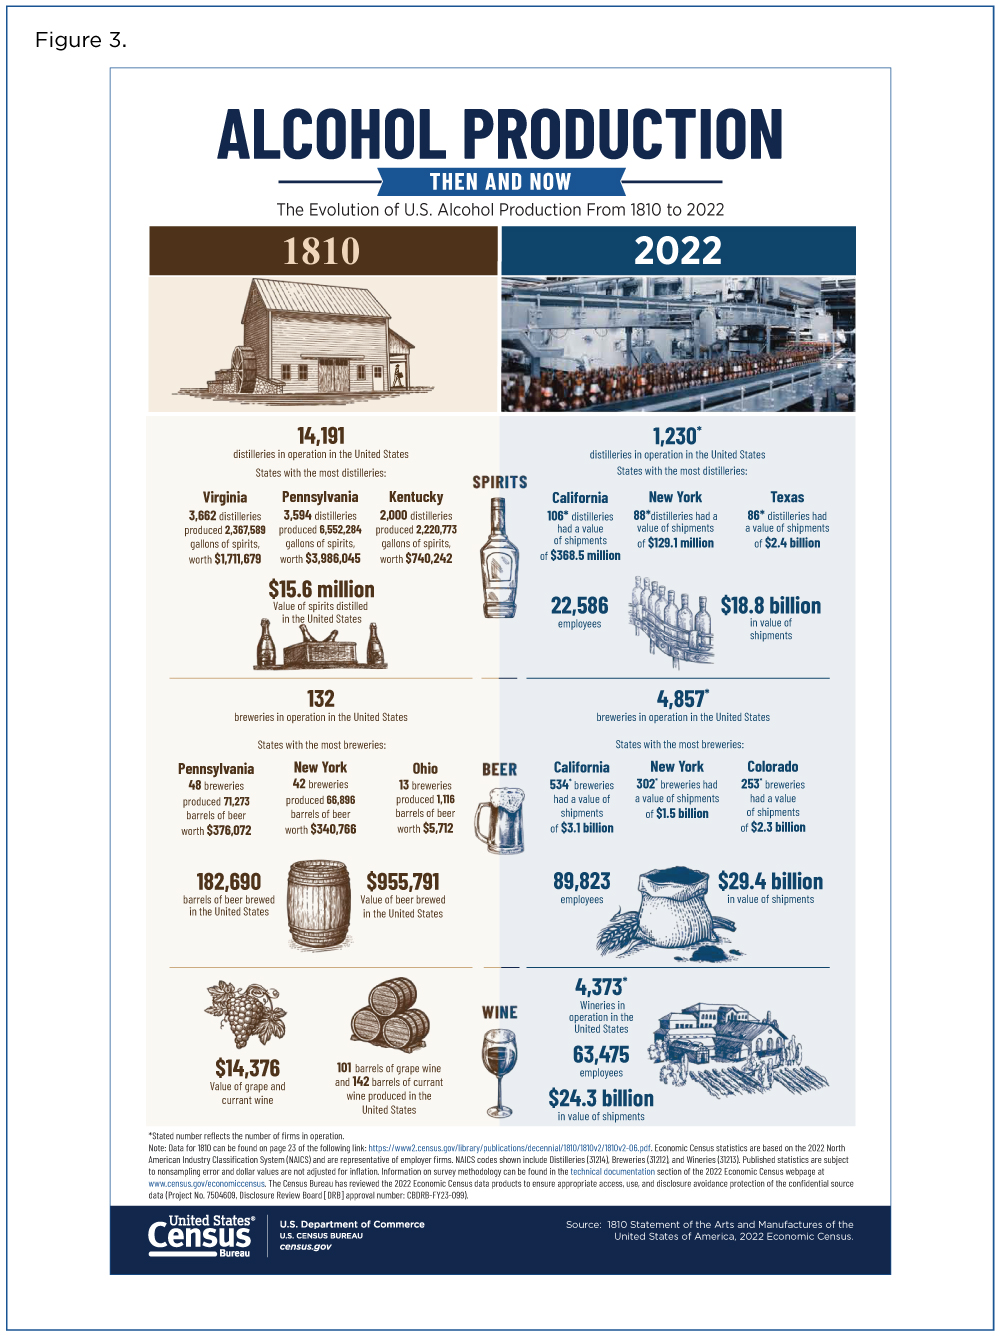
Figure 3 is an example of more than two centuries of change in one industry: alcoholic beverages manufacturing.
For example, although the data were incomplete, the 1810 Statement of the Arts and Manufactures reported 132 breweries in operation and the 2022 Economic Census counted 4,857 firms that owned breweries.
There were actually more U.S. distilleries in 1810 (14,191) than in 2022 (1,230) but they generated much less in sales: $15.6 million compared to $18.8 billion (not adjusted for inflation).
The cause of the difference? Turning surplus grain into alcohol was an easy way for homesteaders to preserve their harvest and create their own “liquid currency.”
Impact of Manufacturing on U.S. Economy
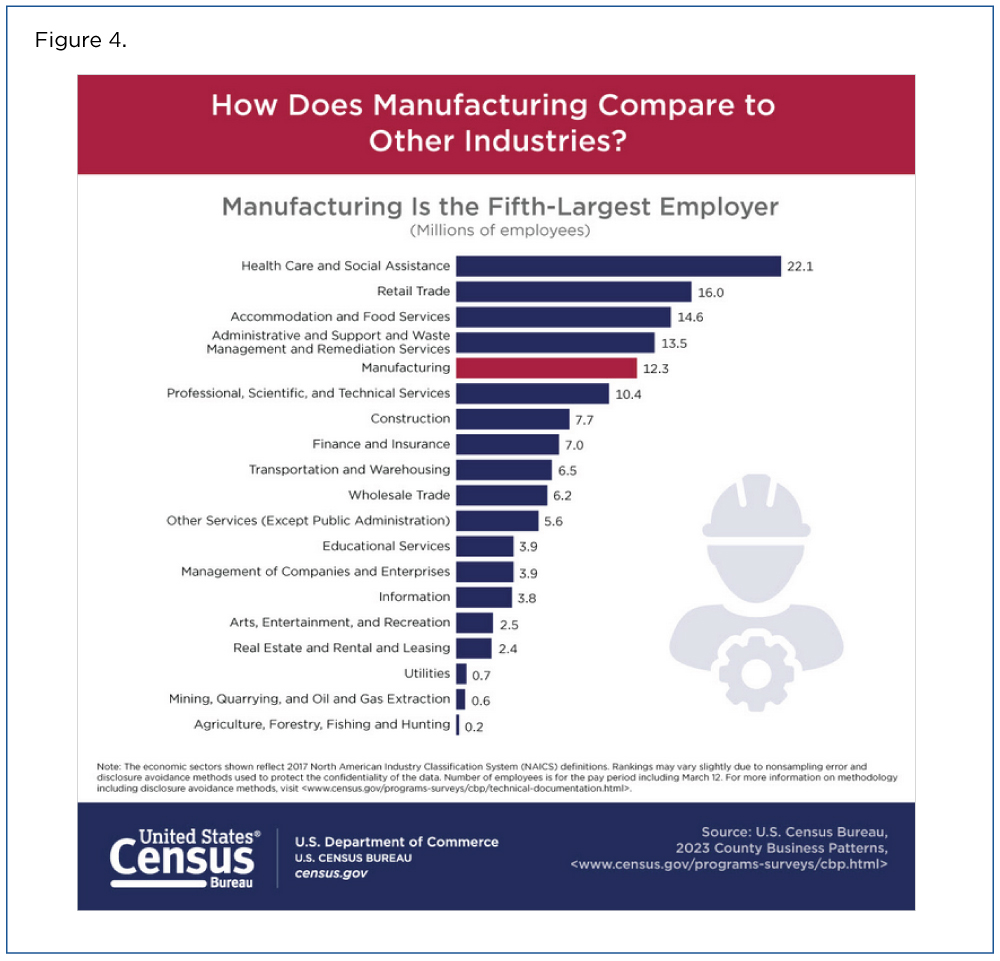
According to the 2023 County Business Patterns, the Manufacturing sector is the fifth-largest employer in the United States, larger than Transportation and Warehousing; Construction; and Professional, Scientific, and Technical Services (Figure 4).
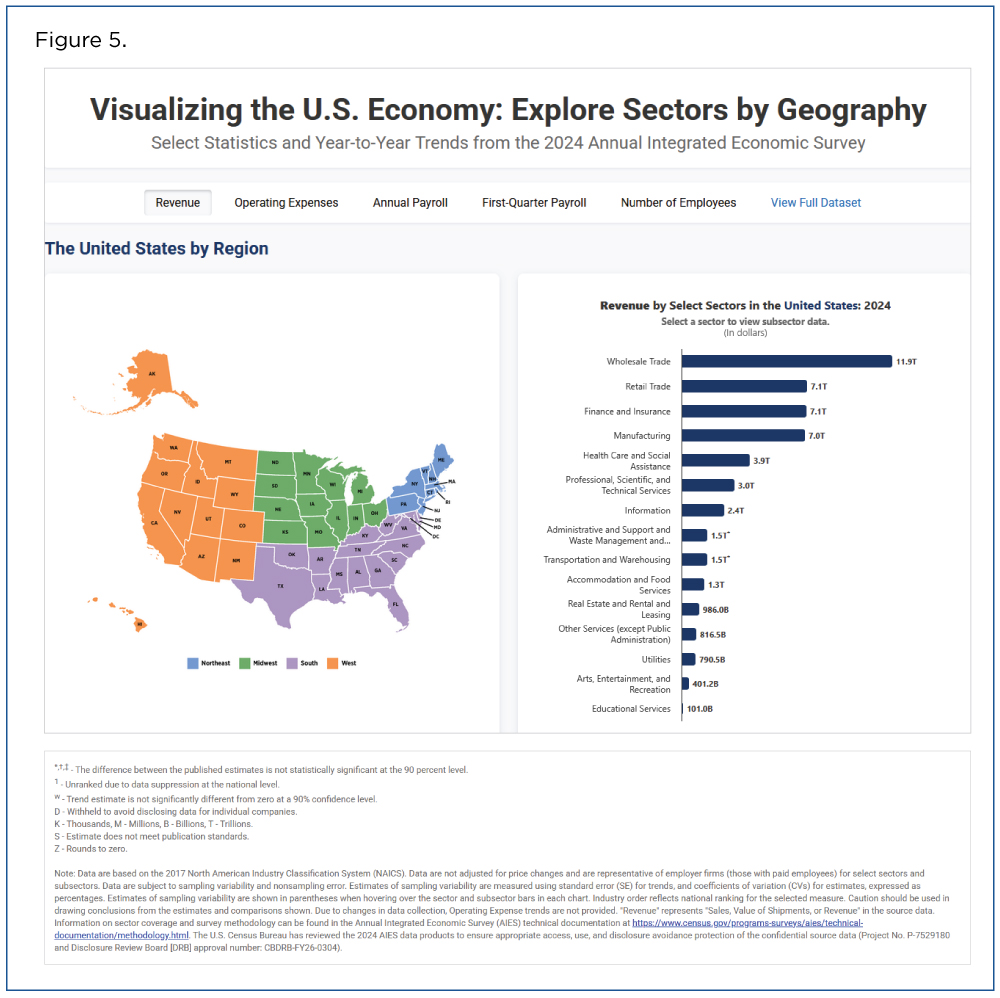
According to the 2024 Annual Integrated Economic Survey (AIES), manufacturing generated $7.0 trillion in total revenue (Figure 5).
Manufacturing Week Webpage
The Census Bureau’s Manufacturing webpage provides manufacturing statistics, data products and a wide range of resources, including other America Counts stories, datasets, data tools, visualizations, training resources and news.
It also highlights careers in manufacturing, part of the sector’s effort to encourage companies and educational institutions around the nation to open their doors to students, parents, teachers and community leaders.
Related Statistics
Subscribe
Our email newsletter is sent out on the day we publish a story. Get an alert directly in your inbox to read, share and blog about our newest stories.
Contact our Public Information Office for media inquiries or interviews.
Related America Counts Stories
-
Business and EconomyU.S. Chemical Manufacturers Grew Despite Overall Manufacturing DeclineMarch 05, 2026The chemical manufacturing industry creates commonplace products like medicine, soap and plastics.
-
NAICS Sector 31-33 ManufacturingSome Less Populous States Have High Manufacturing Revenue Per CapitaSeptember 29, 2025Today is the start of a week of celebrations at the Census Bureau marking the 14th annual Manufacturing Day on October 3.
-
Business and EconomyA Snapshot of Business Growth by County and IndustryOctober 30, 2024A new data visualization from the 2022 County Business Patterns shows the business landscape over 19 economic sectors in the United States and Puerto Rico.
-
Emergency PreparednessEarthquake Risk May Hit Closer to Home Than You ThinkOctober 14, 2026The 140th anniversary of the Charleston earthquake reminds us of the risks to people, housing and economies in places not typically associated with earthquakes.
-
Emergency PreparednessTornado Activity Shifts East — Heightening Risks in the SouthOctober 07, 2026Census data can help vulnerable communities that have a concentration of mobile homes cope with more frequent tornado activity over a longer season.
-
Families and Living ArrangementsU.S. Parents Gave $26.6 Billion to Their Adult Children in 2024September 30, 2026About 2.6 million parents provided financial support to 3.7 million children age 21 and over who did not live at home.
-
Business and EconomyAmerican Manufacturing: A History in Census DataSeptember 28, 2026On the 15th anniversary of Manufacturing Day, we celebrate the sector’s contribution to the U.S. economy.