Language Segregation in U.S. Metropolitan Areas, 2011
Language Segregation in U.S. Metropolitan Areas, 2011
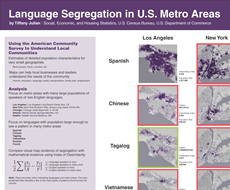
This graphic makes use of the American Community Survey to examine the distribution of language use in metro areas with many large populations of speakers of non-English languages, including Los Angeles, New York, Chicago, Atlanta, and Seattle.
The focus is on languages with populations large enough to see a pattern in many metro areas. These include Spanish, Chinese, Tagalog, Vietnamese, Russian, and French. The graphic allows comparison of evidence of segregation in the visual map with mathematical evidence using Index of Dissimilarity.
Page Last Revised - October 8, 2021


