Benchmarking the Redesigned Survey of Income and Program Participation
Benchmarking the Redesigned Survey of Income and Program Participation
Introduction
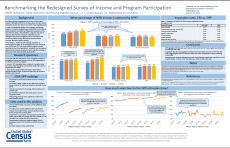
This poster compares aggregate estimates in the redesigned 2014 SIPP panel against similar estimates from National Income and Product Accounts (NIPA) and program administrative data sources. Focusing on program and retirement income across the four waves of the 2014 SIPP panel, it compares yearly aggregate respondent counts and benefit summary measures for SIPP and NIPA. The poster investigates seam bias by comparing beneficiary counts and program transitions against available monthly program administrative data. As a measure of nonresponse, it compares proportions of imputed income across program income sources in SIPP and CPS.
Page Last Revised - October 8, 2021


