Medición de la diversidad racial y étnica para el Censo del 2020
Medición de la diversidad racial y étnica para el Censo del 2020
Tiempo estimado de lectura: 8 minutos
Más adelante este mes, la Oficina del Censo de los EE. UU. planea publicar los primeros resultados del Censo del 2020 sobre raza y origen étnico. Estos datos proporcionarán un panorama general de la composición y diversidad racial y étnica de la población de los EE. UU. al 1 de abril de 2020.
Publicaremos las siguientes medidas de diversidad para presentar y analizar claramente la complejidad de los resultados del Censo del 2020 comparados con los resultados del Censo del 2010:
- Índice de diversidad.
- Clasificaciones de prevalencia y puntuación de difusión.
- Mapas de prevalencia.
En este blog proporcionamos un adelanto de estas medidas y explicamos qué indica cada una sobre la composición y diversidad racial y étnica de la nación.
El concepto de “composición” se refiere a la conformación racial y étnica de una población.
El concepto de “diversidad” se refiere a la representación y el tamaño relativo de diferentes grupos raciales y étnicos dentro de una población, y el máximo de diversidad es cuando todos los grupos están representados en un área y representan porcentajes iguales de la población.
Clasificar la raza y el origen étnico
Primero, es importante saber cómo recopilamos y tabulamos los datos sobre raza y origen étnico en el Censo del 2020. Como otras agencias de estadísticas, seguimos los estándares sobre raza y origen étnico (solo en inglés) establecidos por la Oficina de Administración y Presupuesto (OMB, por sus siglas en inglés) de los EE. UU. en 1997. Estos estándares sirven de guía para cómo el gobierno federal recopila y presenta los datos sobre estos temas. Según estos estándares:
- El Censo del 2020 recopiló datos sobre origen hispano (solo en inglés) y raza (solo en inglés) en dos preguntas separadas.
- Tabulamos las respuestas en base a categorías estándares.
Para raza, los estándares de la OMB identifican cinco categorías mínimas:
- Blanca
- Negra o afroamericana
- Indígena de las Américas o nativa de Alaska
- Asiática
- Nativa de Hawái o de otra de las islas del Pacífico
Usamos una sexta categoría, Alguna otra raza, para personas que no se identifican con ninguna de las categorías raciales de la OMB.
Tabulamos estadísticas sobre las personas que informan solamente una raza de estas seis categorías de “Una sola raza” e incluimos a personas que informan múltiples razas en la población “Multirracial”, también conocida como la población de “Dos o más razas”.
Para origen étnico, los estándares de la OMB clasifican a las personas en una de dos categorías: “Hispano o latino” o “No hispano o latino”. Usamos el término “Hispano o latino” y el término “Hispano” indistintamente y también nos referimos a este concepto como “origen étnico”.
Los estándares de la OMB también enfatizan que las personas de origen hispano pueden ser de cualquier raza. En las tablas de datos, a menudo hacemos una tabulación cruzada de las categorías raza y origen hispano para mostrar Hispano como una sola categoría y los grupos raciales no hispanos como categorías que conforman el total de la población.
Estos cálculos de diversidad requieren el uso de categorías raciales y étnicas mutuamente exclusivas (no superpuestas). Para nuestros análisis, calculamos la población hispana o latina de cualquier raza como una categoría, cada raza sola, grupos no hispanos como categorías individuales, y el grupo multirracial no hispano como una categoría distinta.
Los siguientes grupos se usan en los cálculos de diversidad:
- Hispano
- Blanco solamente, no hispano
- Negro o afroamericano solamente, no hispano
- Indígena de las Américas y nativo de Alaska solamente, no hispano
- Asiático solamente, no hispano
- Nativo de Hawái y de otra de las islas del Pacífico solamente, no hispano
- Alguna otra raza solamente, no hispano
- Multirracial, no hispano
El blog reciente, Mejoras en las preguntas sobre origen hispano y raza y en los procedimientos de codificación del Censo del 2020 (solo en inglés), describe cómo codificamos las respuestas escritas en estas categorías estándares.
Índice de diversidad
Una de las medidas que usaremos para presentar los resultados del Censo del 2020 es el Índice de diversidad, o DI (por sus siglas en inglés). Este índice muestra la probabilidad de que dos personas elegidas al azar sean de diferentes grupos raciales y étnicos.
El DI está limitado entre 0 y 1, con un valor de cero que indica que todos en la población tienen las mismas características raciales y étnicas, mientras que un valor cercano a 1 indica que todos en la población tienen diferentes características.
Convertimos las probabilidades en porcentajes para hacer que los resultados sean más fáciles de interpretar. En este formato, el DI nos indica la probabilidad de que dos personas elegidas al azar sean de diferentes grupos raciales y étnicos.
Para ilustrar cómo funciona el DI, comparamos la composición de tres poblaciones hipotéticas a continuación.
En la figura 1, la población está compuesta de solo dos grupos grandes y parejos. El DI para esta población indica que hay una posibilidad del 50 % de que dos personas elegidas al azar sean de diferentes grupos raciales y étnicos.
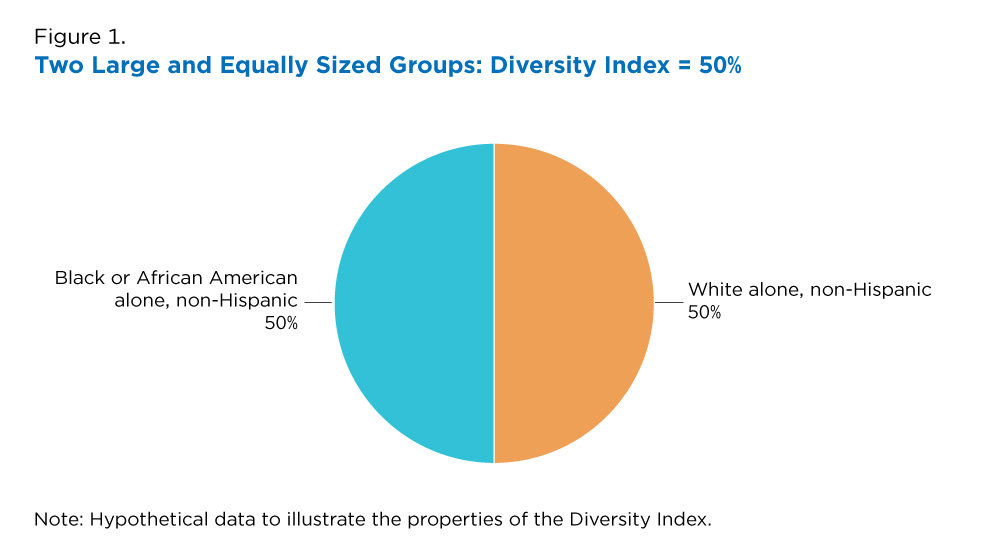
Figure 2, the second hypothetical example, shows a population with four equally sized groups where the DI is 75%. The chance that the two people come from different race and ethnic groups is increased, even though the size of each group is smaller than in the first example.
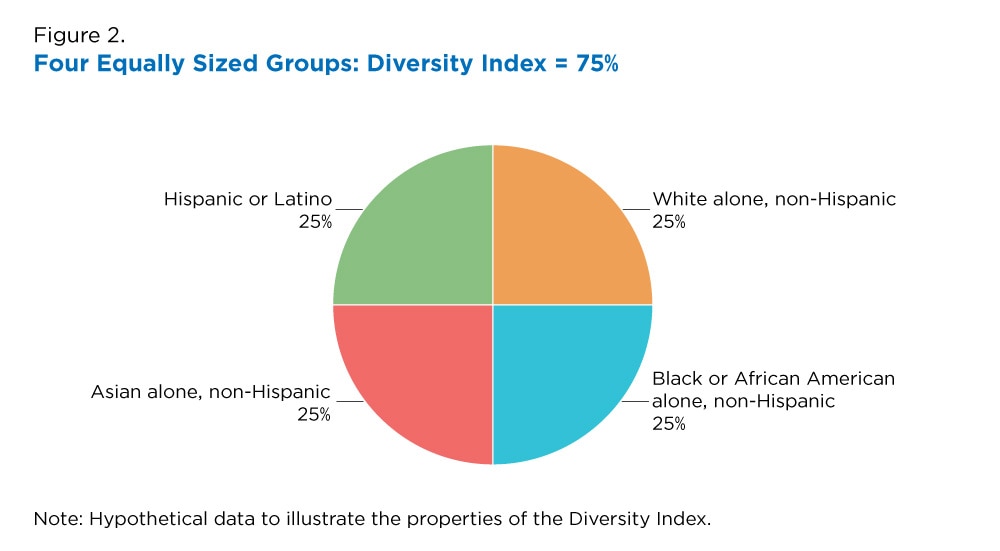
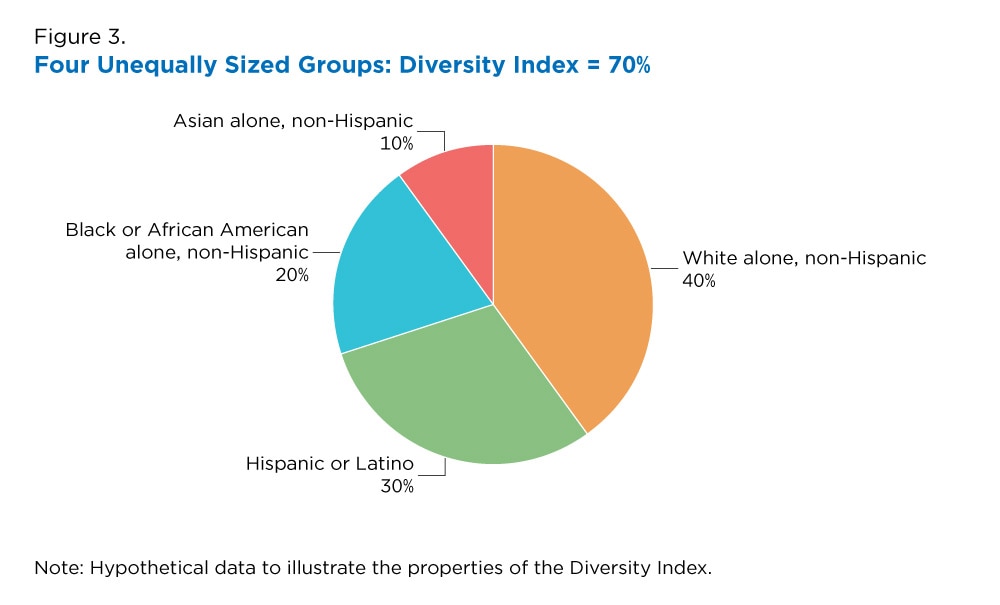
Figure 3 shows a hypothetical population with four unequally sized groups and a DI of 70%. Comparing Figure 2 and Figure 3, we see that the relative size of the racial and ethnic groups affects the DI score by decreasing the probability when some groups are larger than the others.
The DI for actual data from the 2010 Census for the United States and selected states illustrate how the metric can vary based on the distribution of the population by race and ethnicity. In 2010, there was a 54.9% chance that two people chosen at random from the U.S. population would be from different race or ethnicity groups (Figure 4).

In 2010, the DI varied greatly by state (not shown). Among all states, the DI ranged from a low of 10.8% in Maine to a high of 75.1% in Hawaii.
Prevalence Rankings and Diffusion Score
We can also measure racial and ethnic diversity using prevalence rankings and the diffusion score.
With prevalence rankings, which show the most common group in an area, we look at patterns in the percentage of the population that falls into the largest race or ethnic group, second-largest group, and third-largest group. The prevalence ranking approach uses tables or graphs to show the percentages of the largest groups.
From the rankings on 2010 Census data, we find:
- The White alone, non-Hispanic population was the largest racial or ethnic group in the United States at 63.7%.
- The Hispanic population was the second-largest at 16.3%.
- The Black or African American alone, non-Hispanic population was third-largest at 12.2%.
The diffusion score measures the percentage of the population that is not in the first-, second- or third-largest racial and ethnic groups combined. This metric tells us how diverse and unconcentrated the population is relative to the three largest groups.
For example, the diffusion score for the United States was 7.7% in 2010, as 7.7% of the population was not one of the three largest racial or ethnic groups. When we look across the country, we see a lot of variation in the diffusion scores by state in 2010.
- The diffusion score was highest in Hawaii at 20.1%, indicating that one-fifth of the population was in a racial or ethnic group that was not one of the three largest groups for the state.
- The next highest diffusion score was for Alaska with 15.1%, followed by Oklahoma with 14.3%.
- The lowest diffusion score was in West Virginia at 2.1%.
Prevalence Mapping
The final conceptual approach to illustrate the racial and ethnic diversity of the population is to map the most prevalent racial or ethnic group for all counties in the United States.
These prevalence maps show the geographic distribution of the largest or second-largest racial or ethnic group. It is similar to the prevalence ranking approach shown above.
Below we provide examples of prevalence maps for counties using data from the 2010 Census. We will use similar prevalence maps to highlight the racial and ethnic composition and diversity in the 2020 Census results.
Figure 5 shows the most prevalent racial or ethnic group for each county in 2010.

For most counties, White alone, non-Hispanic was the most prevalent group.
However, we see some regional variation:
- In the South, Black or African American alone, non-Hispanic was the largest group in some counties.
- In the West and Southwest, Hispanic or Latino was the largest group for a subset of counties.
- In Alaska and parts of the Midwest and Southwest, American Indian or Alaska Native alone, non-Hispanic was the most prevalent group.
Figure 6 shows the second-most prevalent racial and ethnic group for each county.

The number of racial or ethnic groups represented in the map increases. For example, the Asian alone, non-Hispanic population and the Multiracial, non-Hispanic population are now represented in some counties on the map as the second-most prevalent group. As with Figure 5, we also see regional patterns in the racial and ethnic distribution of the population.
Measuring Diversity Then and Now
We chose this new set of diversity measures — the DI, prevalence maps, prevalence ranking, and diffusion scores — because they have clear conceptual definitions and interpretations. They also overcome some of the limitations of the diversity measures we have used in the past.
In the past, the Census Bureau had sometimes used the concept of “majority” and “minority” for measuring diversity, but this approach has several conceptual and practical challenges that limit its ability to illustrate the complex racial and ethnic diversity of the U.S. population.
For example, while some people classify individuals who identify with multiple population groups (such as Hispanic and White; White and Black or African American; and White and Asian) as part of the majority population, others classify them as part of the minority population. The dual identities of these groups highlight the social, political and economic complexities of race and ethnicity in 21st century U.S. society.
The inclusion of certain groups as part of the “majority” or “minority” has also become more complex and contested in recent decades, especially as many people may not identify with certain population groups even if that is how they are classified and tabulated per federal standards. The majority-minority approach is ambiguous, and it is further complicated by complex demographic and social realities.
To overcome these limitations, we focused on these alternative race and ethnicity diversity measures to illustrate the racial and ethnic composition of the 2020 Census results. We plan to explore other diversity measures as part of our future research with 2020 Census data.
The analyses scheduled for release later this month will provide a complementary perspective to the statistics in the 2020 Census Redistricting Data (Public Law 94-171) Summary File and will help the public to understand the racial and ethnic makeup of the U.S. population and the myriad diversity of identities that people share.
Acknowledgment
In 2019, the Census Bureau formed the Disseminating Diversity Working Group to develop a strategy for producing statistics on racial and ethnic diversity in the 2020 Census data products and beyond. The working group comprises subject-matter experts in race and ethnicity, demography and data visualization. The diversity measures included in this blog were developed through research and collaborative discussions among the authors, as well as consultation with external experts and advisors. The blog was written by members of the working group and reflects our efforts to clearly communicate statistics about the racial and ethnic diversity of the U.S. population.