Exploring the Racial and Ethnic Diversity of Various Age Groups
Estimated reading time: 9 minutes
The 2020 Census showed that the population under age 18 was more racially and ethnically diverse than the population 18 and over. But how racially and ethnically diverse were other age groups?
The Exploring Age Groups in the 2020 Census interactive data visualization and supplemental tables allow us to answer that question by examining racial and ethnic diversity metrics for several age groups:
- Under 5 years.
- 5 to 17 years.
- 18 to 24 years.
- 25 to 34 years.
- 35 to 44 years.
- 45 to 64 years.
- 65 to 84 years.
- 85 to 99 years.
- 100 years and older.
The interactive visualization contains data from the 2020 Census Demographic and Housing Characteristics File (DHC). The DHC includes information on sex, age, race, Hispanic origin, families, households, housing and homeownership.
Later this month, we plan to release the Detailed DHC-A, which includes population counts and age and sex statistics for detailed racial and ethnic groups, such as Chinese or Mexican, and statistics for American Indian and Alaska Native tribes and villages like the Navajo Nation or the Native Village of Fort Yukon. Be on the lookout for a new interactive data visualization showing maps of the largest and second largest detailed racial and ethnic groups.
In this blog, we will discuss how we measure racial and ethnic diversity and use data from the interactive visualization to show that while the population under 5 years old was the nation’s most racially and ethnically diverse age group, variation existed among geographies.
Defining Diversity
People may have different perceptions of what it means for a population to be diverse. In this blog, the concept of racial and ethnic diversity refers to representation and the relative size of different racial and ethnic groups within a population. Diversity is maximized when all groups are represented in an area and have equal shares of the population.
We have used several approaches to measure the racial and ethnic diversity of the U.S. population in the 2020 Census results. The data visualization includes the racial and ethnic diversity index and prevalence maps.
The diversity index tells us how likely two people chosen at random will be from different race and ethnicity groups. A value of 0 indicates that everyone in the population has the same racial and ethnic characteristics. A value close to 100 indicates that almost everyone in the population has different racial and ethnic characteristics.
To calculate the diversity index, the groups need to be mutually exclusive or non-overlapping. We used the following racial and ethnic groups for this analysis:
- Hispanic or Latino of any race.
- White alone, non-Hispanic.
- Black or African American alone, non-Hispanic.
- American Indian and Alaska Native alone, non-Hispanic.
- Asian alone, non-Hispanic.
- Native Hawaiian and Other Pacific Islander alone, non-Hispanic.
- Some Other Race alone, non-Hispanic.
- Multiracial (or “Two or More Races”), non-Hispanic.
Prevalence maps show the geographic distribution of the largest, second largest or third largest racial or ethnic group at a specific geographic level. These maps often reveal regional patterns in how the U.S. population is spatially distributed by race and ethnicity.
Racial and Ethnic Diversity Index by Age Group
In 2020, the diversity index of the total population was 61.1%, meaning that there was a 61.1% chance that two people chosen at random were from different racial or ethnic groups. In 2010, there was a 54.9% chance. This indicates that the diversity of the U.S. population increased between 2010 and 2020.
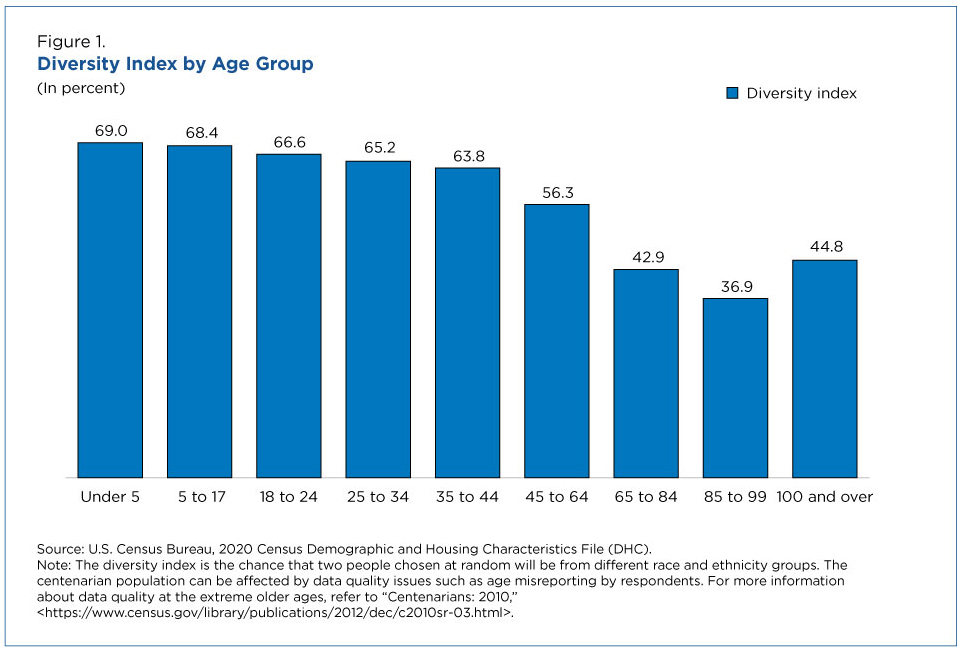
Among all age groups at the national level, the chance that two people chosen at random were from different racial or ethnic groups was highest for those under 5 years at 69.0% and lowest for those 85 to 99 years at 36.9%.
For most states, the diversity index was highest for the population under 5 years, matching the national trend. There were a few states, however, where that wasn’t the case:
- In California, the age group with the highest diversity index was 35 to 44 years (69.9%). This was followed closely by 45 to 64 years (69.8%) and 25 to 34 years (69.7%). The 18-to-24 age group also had a higher diversity index than the population under 5 years (67.1% compared with 66.7%).
- In Texas, the population 35 to 44 years had the highest diversity index (68.0%). The population 25 to 34 years (67.7%) had the second highest diversity index.
- In New Mexico, the population ages 25 to 34 had the highest diversity index (63.6%), followed by the populations 35 to 44 years (63.3%) and 45 to 64 years (63.0%).
- In Hawaii and the District of Columbia, a state equivalent, the population 18 to 24 years was the group with the highest diversity index (79.4% and 69.8%, respectively).
For most age groups, Hawaii was the state with the highest diversity index and Maine the lowest (excluding Puerto Rico).
- Hawaii had the highest diversity index for the total population and every age group except the populations ages 85 to 99 and 100 years and over. For those two age groups, California had the highest diversity index.
- West Virginia had the lowest diversity index for those under age 5, 5 to 17, and 18 to 24. Maine had the lowest diversity index for the total population and 25 to 34 years, 35 to 44 years, 45 to 64 years, 65 to 84 years and 85 to 99 years, and Iowa had the lowest diversity index for centenarians (excluding Puerto Rico).
- Other state rankings varied by age group. For example, while Oklahoma had the fourth highest diversity index for under 5 years, it ranked 23rd for 85 to 99 years.
Puerto Rico’s diversity index was much lower than the states — less than 5.0% for every age group.
Racial and Ethnic Prevalence by Age Group
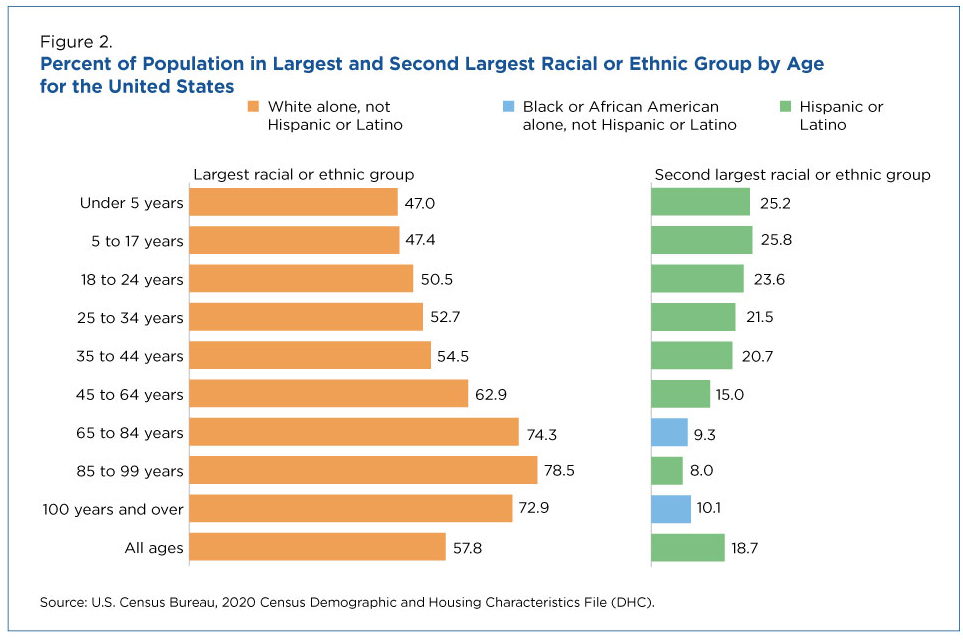
For the United States, the White alone, non-Hispanic population was the largest racial or ethnic group for every age category. Its share of the population varied from 47.0% for the under 5 age group to 78.5% for the 85 to 99 years group.
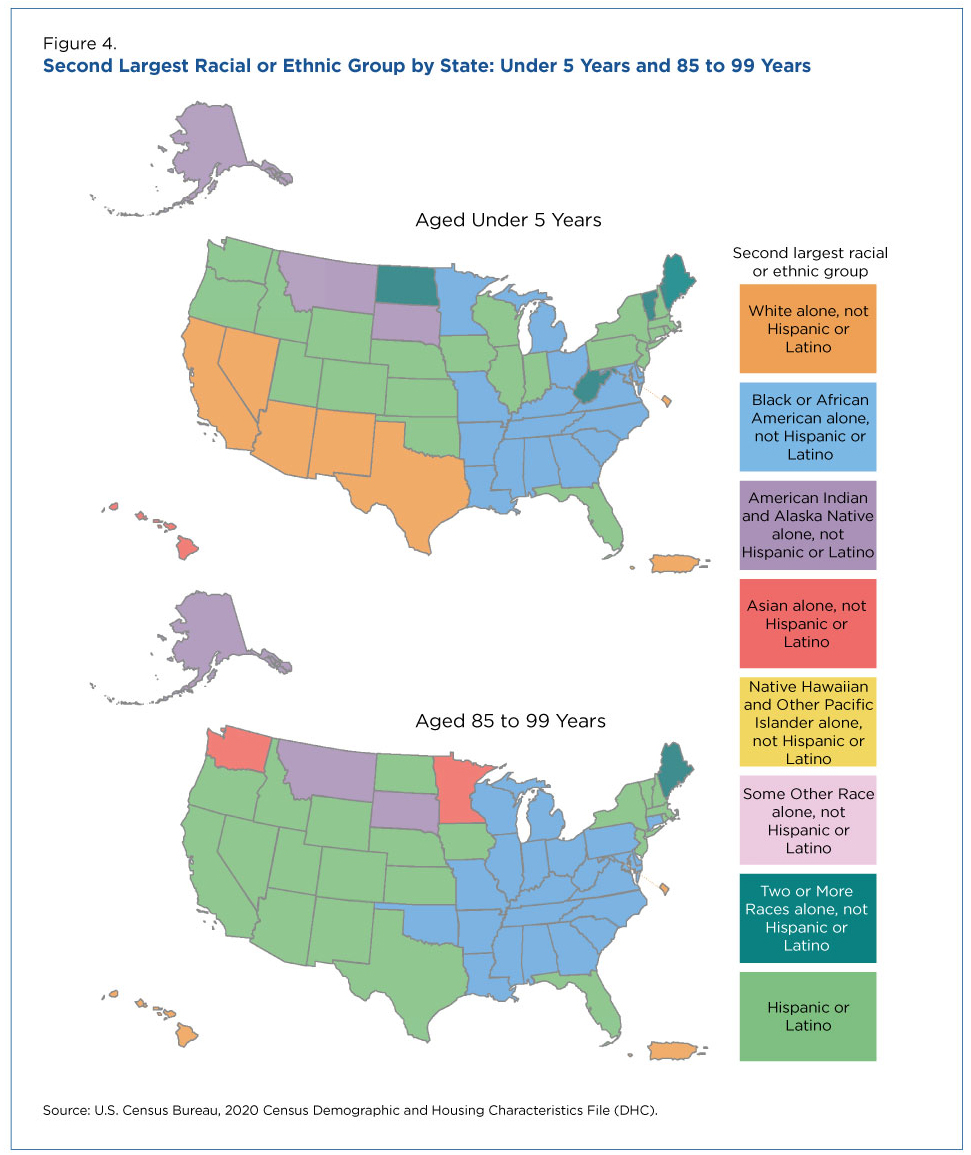
There was some variation for the second largest racial and ethnic group — Hispanic or Latino was the second largest for all age groups under 65 years as well as those ages 85 to 99. Black alone, not Hispanic or Latino was the second largest group for two age groups: 65 to 84 and 100 and over.
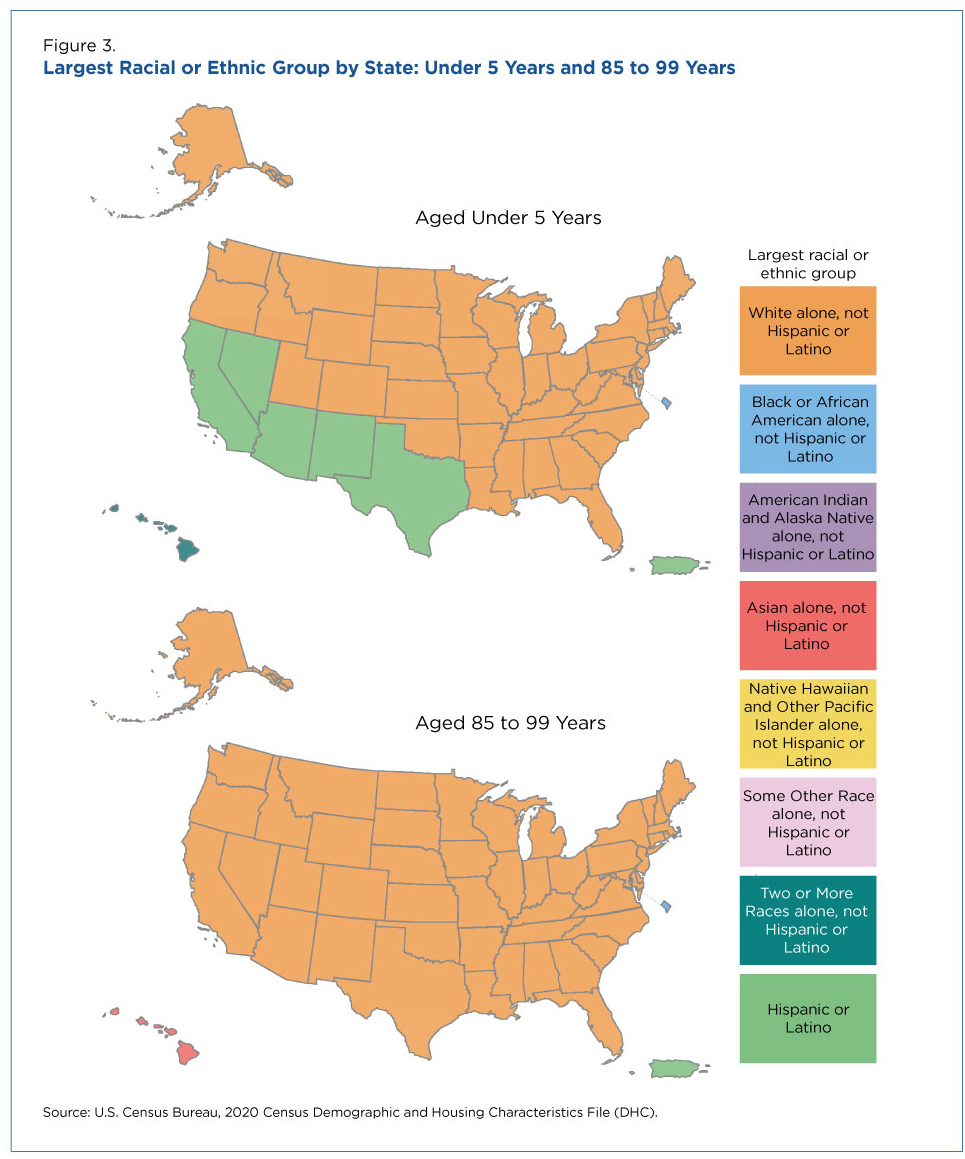
At the state level, the largest racial or ethnic group varied the most for the populations under 5 and 5 to 17 years.
- For the populations under 5 and 5 to 17 years, Hispanic or Latino was the largest group in California, Nevada, Arizona, New Mexico, Texas and Puerto Rico.
- Black or African American alone, non-Hispanic was the largest group in the District of Columbia and Two or More Races, non-Hispanic was the largest group in Hawaii among those under 5 and 5 to 17 years.
- The White alone, non-Hispanic group was the largest racial or ethnic group in 44 states for the two youngest age groups.
For the older age groups (65 and over), the White alone, non-Hispanic population was the most prevalent racial or ethnic group in almost every state.
- For the populations ages 65 to 84, 85 to 99 and 100 and over, White alone, non-Hispanic was the largest group in 49 states.
- Black or African American alone, non-Hispanic was the largest group in the District of Columbia, and Asian alone, non-Hispanic was the largest group in Hawaii among the three oldest age groups.
The second most prevalent racial or ethnic population was not always the same between age groups and the total population:
- There were no states where the Asian alone, non-Hispanic group was the second most prevalent among the total population. However, the Asian alone, non-Hispanic population was the second most prevalent group in Hawaii among those under 5 and 5 to 17 years; in Washington among those ages 65 to 84 and 85 to 99; in Minnesota among those ages 85 to 99; and in California among those 100 years and over.
Explore On Your Own
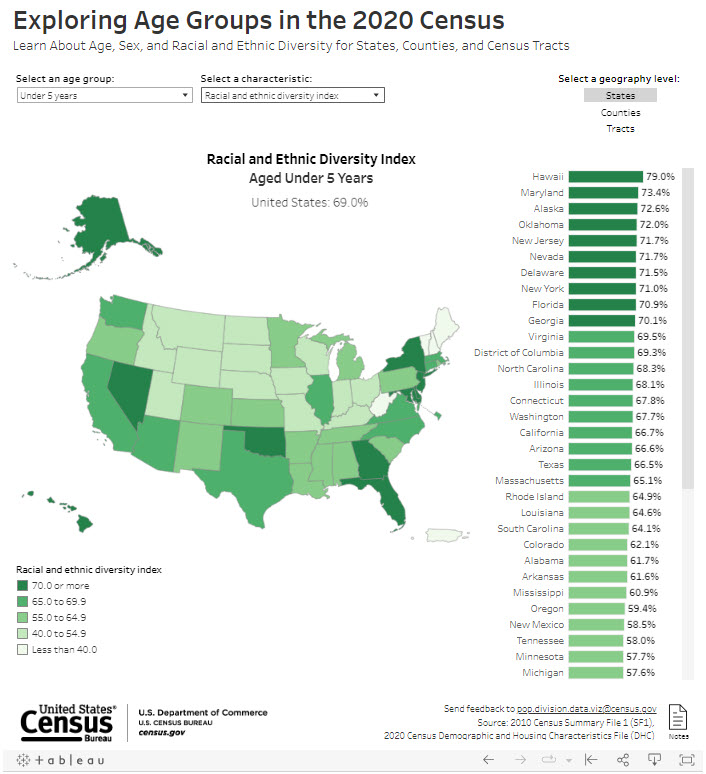
The data presented in this blog can be found in the Exploring Age Groups in the 2020 Census interactive visualization and supplemental tables. Click on the image below to explore racial and ethnic diversity for age groups in your state, county and neighborhood (census tract).
Today, we are also releasing additional supplemental tables containing the largest and second largest racial or ethnic group by age for the nation, states, counties and census tracts.
On September 21, the Census Bureau is set to release the 2020 Census Detailed DHC-A, which will provide more information on detailed racial and ethnic groups. This will include information on the largest and second largest detailed racial and ethnic group for states and counties.
Clearly there is considerable variation in the racial and ethnic diversity of the U.S. population by age. This makes sense given the many demographic and social changes that contribute to the racial and ethnic composition and diversity of the population. Among them: immigration, multiracial relationships, trends in fertility and mortality patterns. These demographic trends appear to have impacted the racial and ethnic diversity of people differently depending on their age.
The racial and ethnic diversity of the U.S. population not only varies by age group but also by geography. This added dimension highlights the complexity of race and ethnicity in the United States. Again, we invite you to explore the data visualization, especially the results for states, counties and census tracts, to learn more about the racial and ethnic diversity of the U.S. population as measured in the 2020 Census.
