CPS ASEC Redesign and Processing Changes
CPS ASEC Redesign and Processing Changes
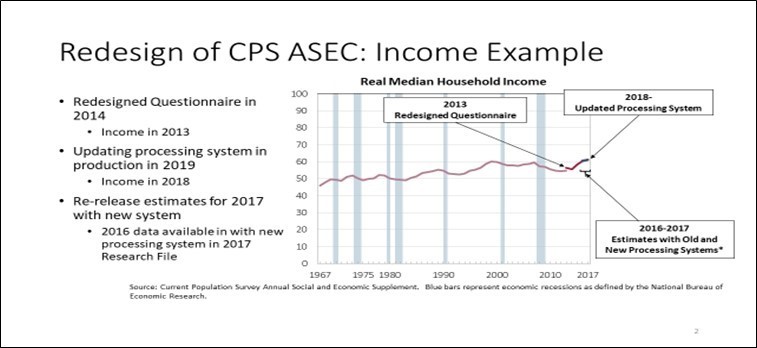
The U.S. Census Bureau has been engaged for the past several years in implementing improvements to the Current Population Survey Annual Social and Economic Supplement (CPS ASEC) income, health insurance and demographic content. These changes have been implemented in a two-step process, beginning first with questionnaire design changes incorporated over the period of 2014 to 2016 followed by more recent changes to the data processing system.
This month, the U.S. Census Bureau will release income, poverty and health insurance coverage statistics in three new annual reports: Income and Poverty in the United States: 2018, The Supplemental Poverty Measure: 2018 and Health Insurance Coverage in the United States: 2018. These reports mark the first time, income, poverty and health insurance measures will reflect important changes to the processing system for the CPS ASEC. These reports will present year-to-year comparisons from 2017 to 2018 based on data edited using an updated data processing system for both years. In some cases, 2017 estimates may diverge from values published in September 2018, which were created using the legacy processing system.
The CPS ASEC is the official source of poverty estimates for the United States. In 2014, the Census Bureau introduced redesigned income and health insurance questions, followed by changes beginning in 2015 to allow spouses and unmarried partners to specifically identify as opposite- or same-sex. While data collection methods reflected most of these changes immediately, data processing changes to take full advantage of this new content have only recently been finalized.
The new processing system changes how the Census Bureau imputes missing data on income, health insurance and family relationships. It also produces some new income and health insurance variables.
The Census Bureau has engaged its data users in this process. Presentations have been made at several conferences, including the Population Association of America, the Joint Statistical Meetings, the Society of Government Economists, the Association of Public Data Users and the Federal Committee on Statistical Methodology. In May 2019, the Census Bureau hosted an expert meeting at its headquarters to discuss the impact of the changes. Materials from many of these presentations and the expert meeting are available on our website. On September 4, the Census Bureau will host a special pre-release webinar for the media.
In April, the Census Bureau released a re-run of 2018 CPS ASEC public-use data using the updated processing system. These data had previously been released in September 2018 using the legacy edit procedures. The April release was accompanied by several working papers, notes and tables summarizing differences between estimates from the legacy and the updated processing systems. Public-use microdata files, a data dictionary and supplemental technical documentation are available on the Census Bureau website. Similar resources were released in January for the 2017 CPS ASEC.
In July 2019, the Census Bureau released complete income and poverty table packages with estimates for 2017 from the updated processing system. These table packages include the estimates that will be used in the September 2019 reports to analyze year-to-year changes between 2017 and 2018.
This blog provides highlights of the analyses that have been completed looking at the impact of the updated processing system on income, earnings, poverty and health insurance estimates.
There were a number of changes introduced in the CPS ASEC questionnaire in 2014. These included: (a) new retirement income questions to reflect the change from defined-benefit to defined-contribution plans; (b) the option to provide income in “ranges” when a respondent could not or would not give a specific dollar amount; and (c) elimination of the “screeners” which filtered questions by household income. The updated processing system takes advantage of these new data and also overhauls the imputation system, removes caps on means-tested program benefits, increases top codes for some income types and improves income allocation flags.
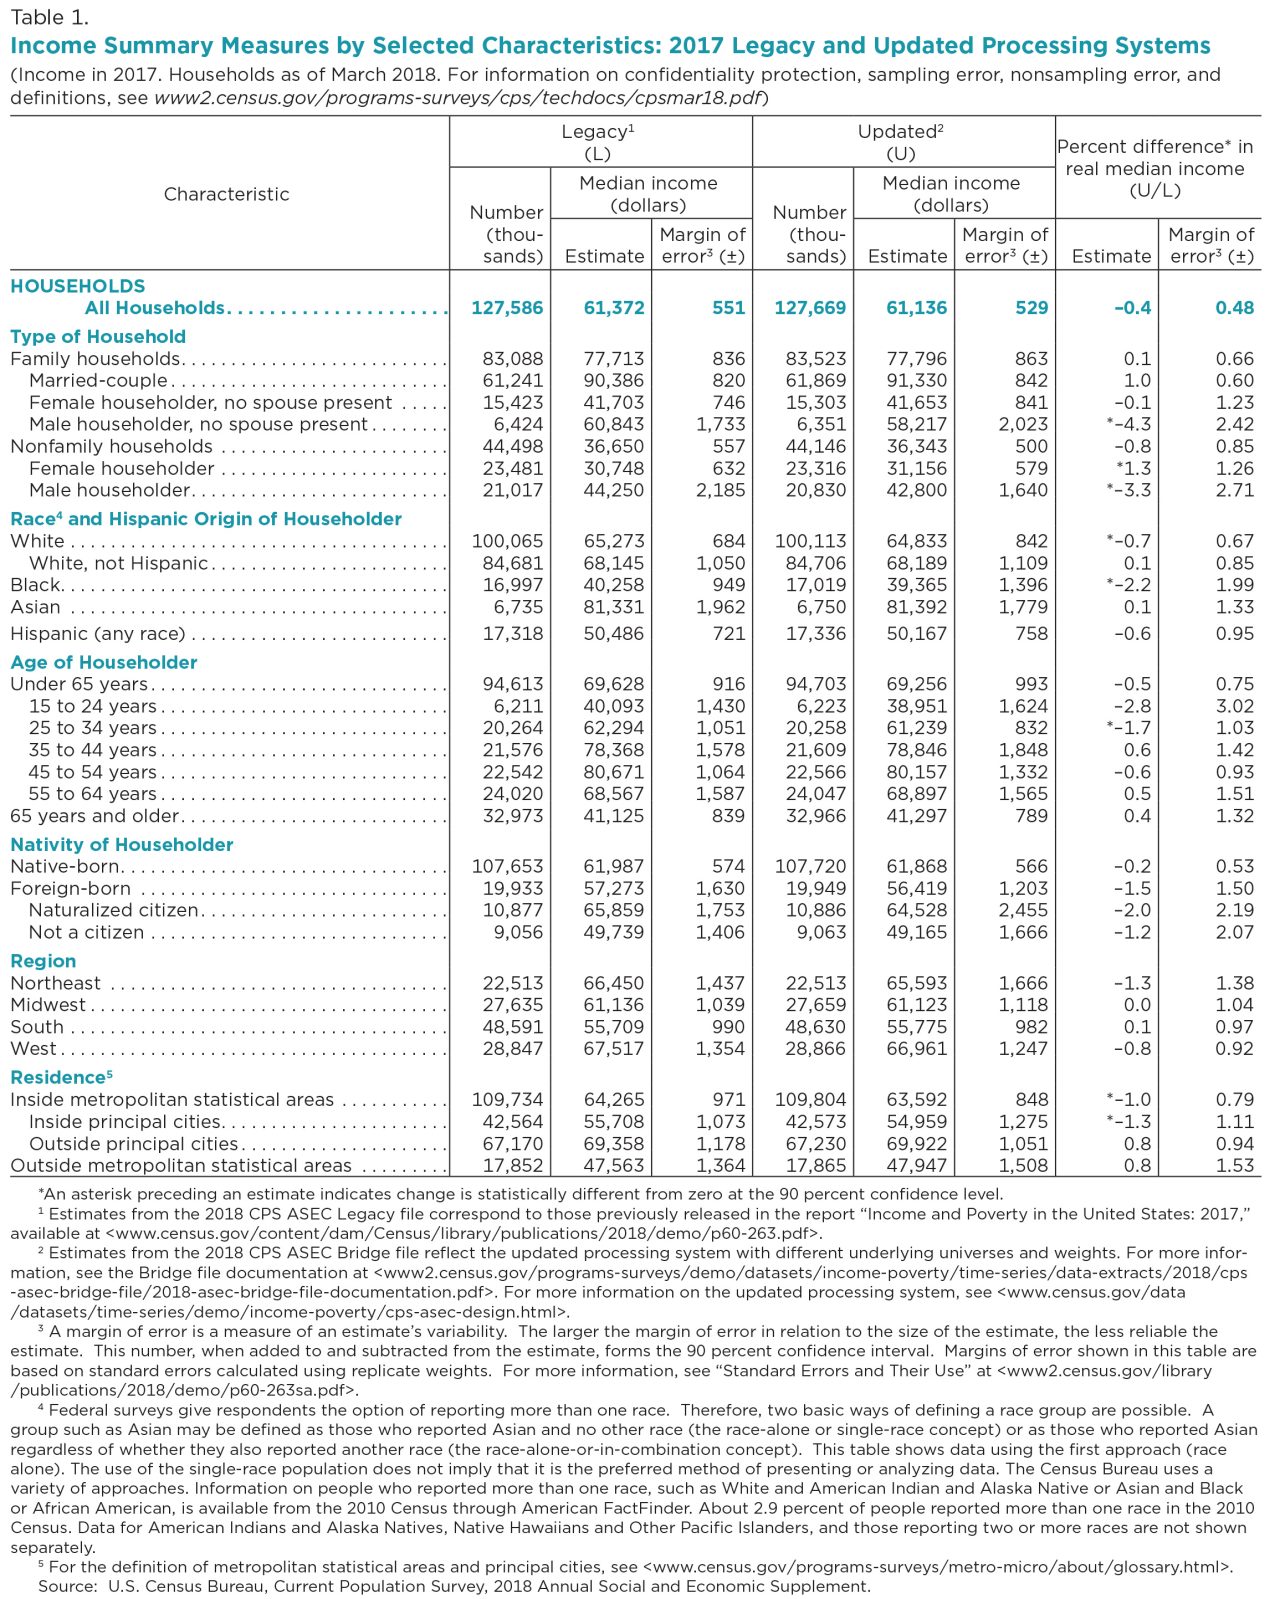
At the median, this resulted in only minor differences in household income for most demographic groups. In 2017, the difference in overall median household income across the two processing systems was not statistically significant. The only major demographic/geographic groups with statistically significant differences in median household income were whites, blacks and people living inside principal cities. For earnings, there were statistically significant increases at the median for all workers and all full-time, year-round workers.
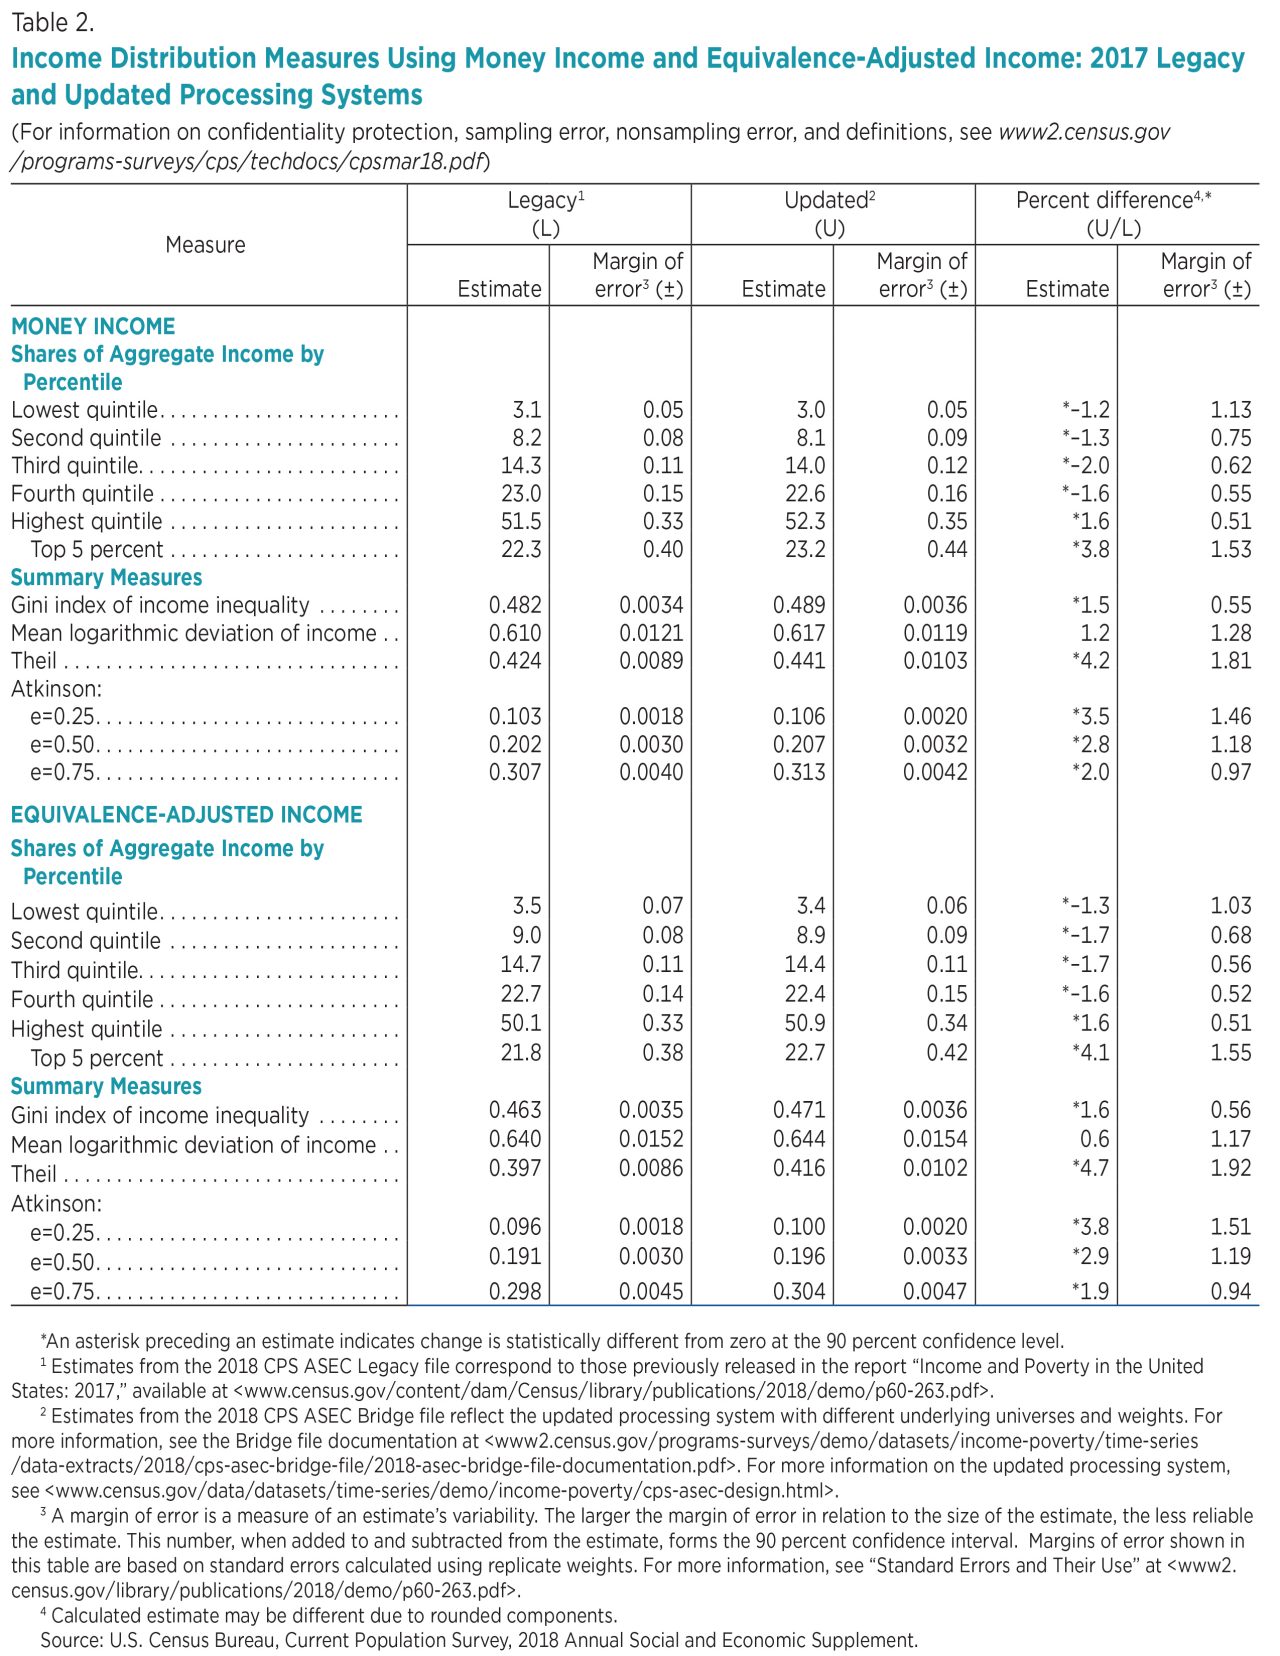
These results were not consistent across the income distribution. For households at the 95th percentile, overall household income was up 2.8% with the new processing system, a likely result of higher top codes for many income sources. At the bottom of the distribution, as measured by the 10th percentile, overall income was not statistically different but income was up for households with an Asian reference person and down for those with a reference person 65 years or older.
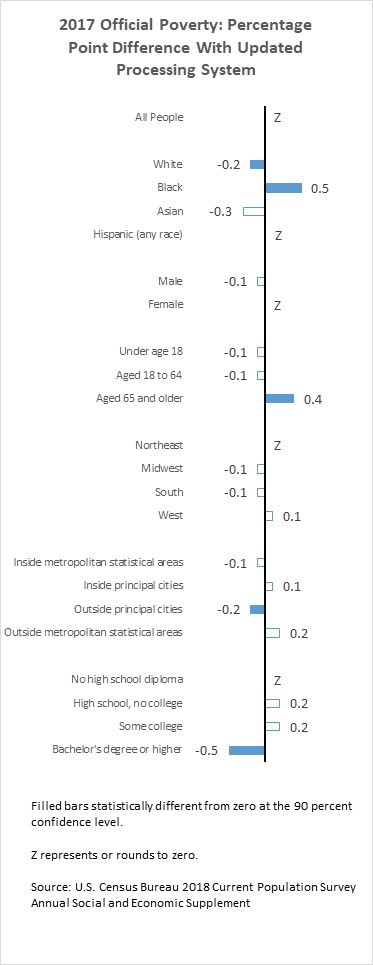
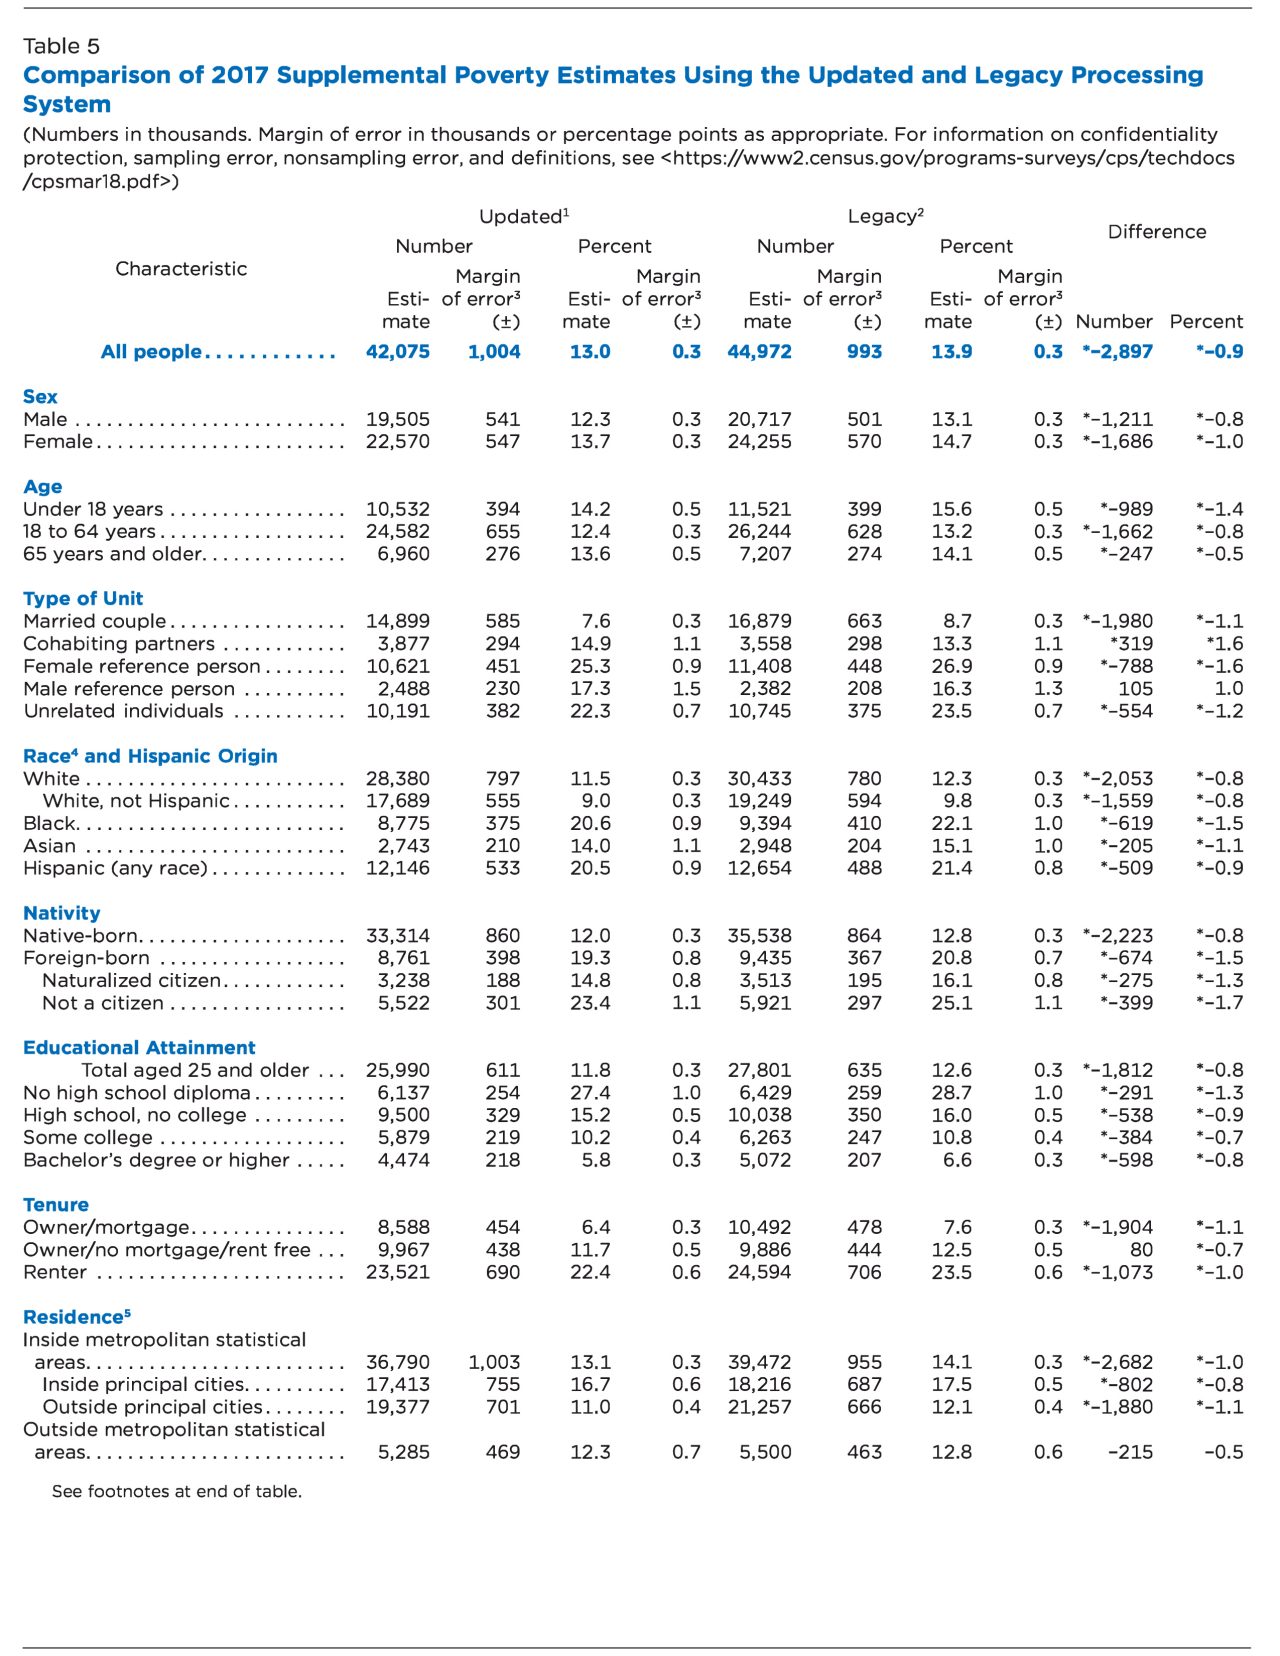
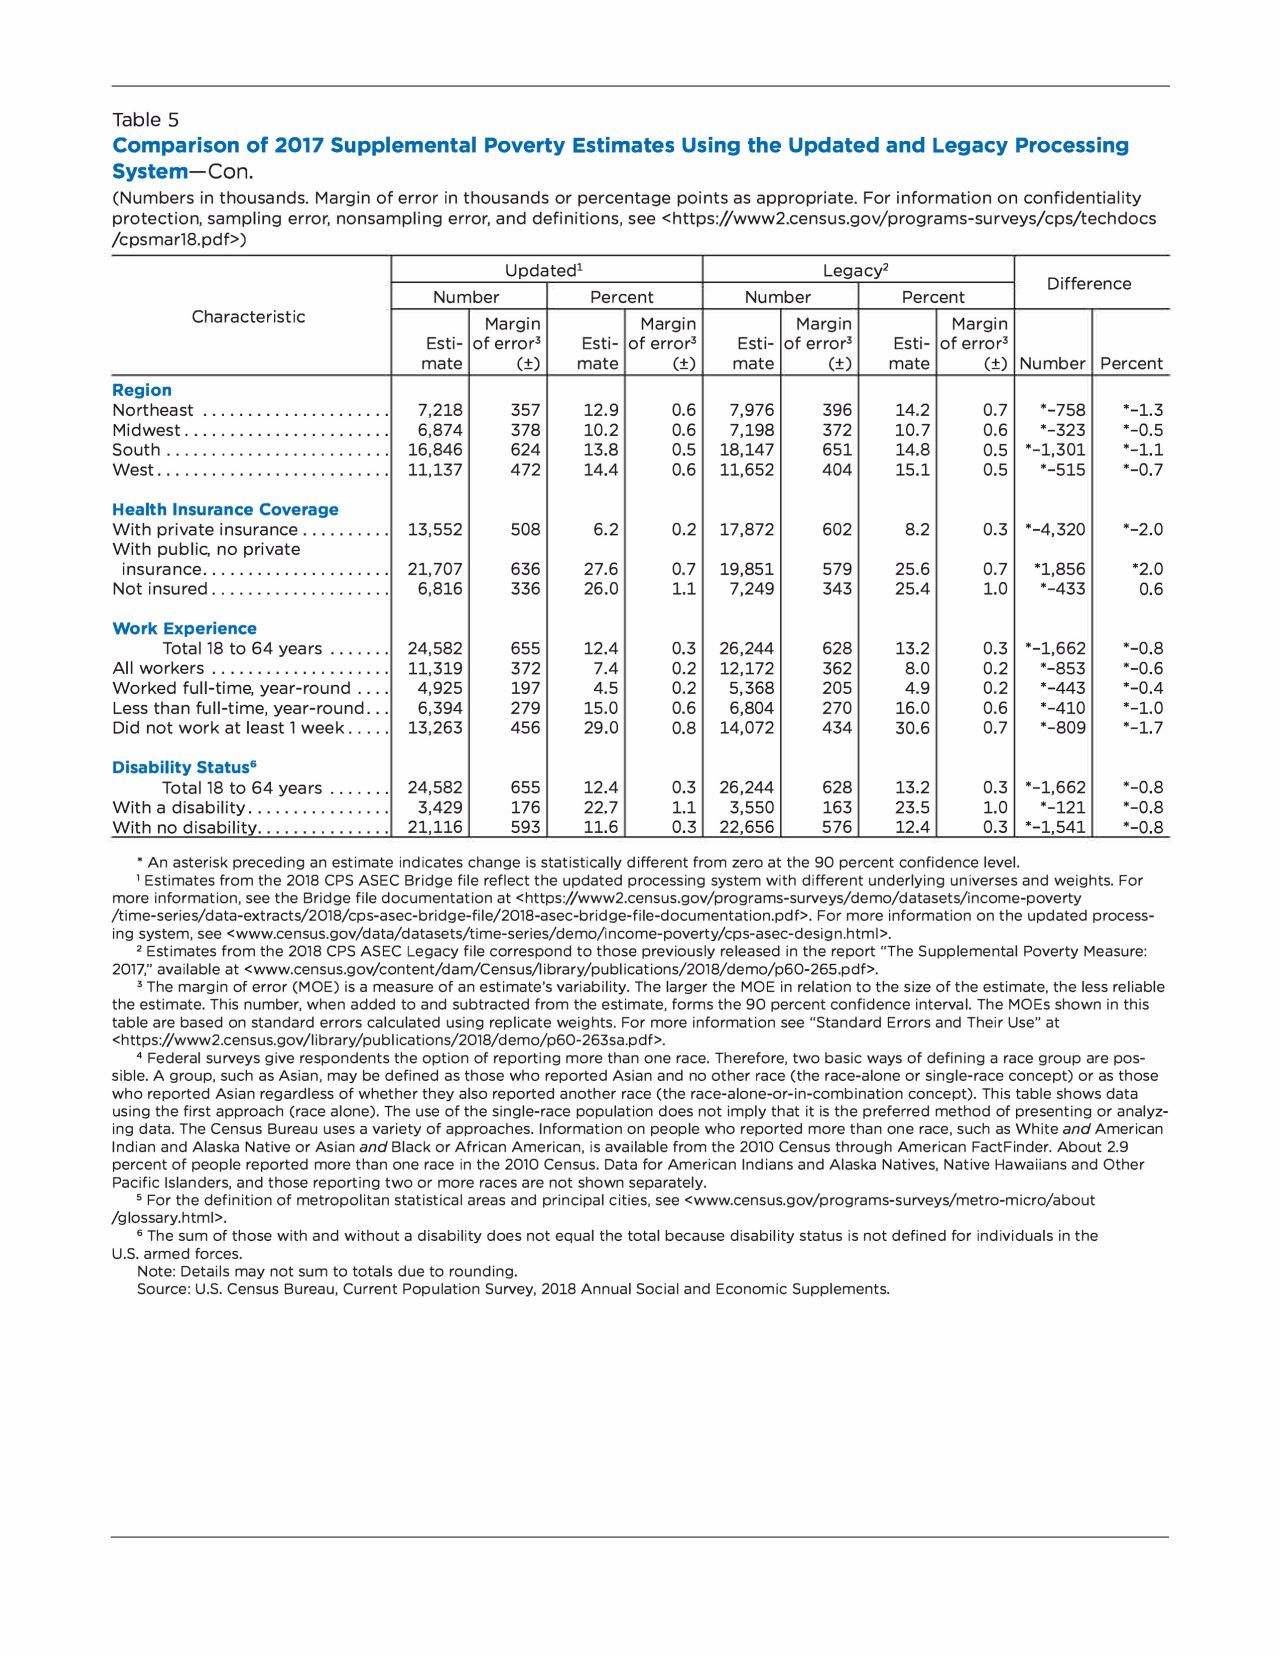
For official poverty in 2017, there were no statistically significant differences in either the number or percentage of total people in poverty when using the updated processing system compared to the legacy processing system. There were statistically significant differences in poverty rates by select demographic characteristics, including race, age, metropolitan status and educational attainment.
Poverty rates went down for whites and up for blacks when moving to the new processing system. By age, individuals 65 years and older were the only group to experience a significant change in their poverty rates due to the new processing system. Geographically, statistical differences across processing systems were limited to those living inside metropolitan statistical areas but outside principal cities. There were no statistical differences in poverty rates by region. Individuals 25 and older with advanced education including a bachelor’s degree or higher—who already had among the lowest poverty rates when using the legacy processing system—were the only educational attainment group to see a significant change in their poverty rates when implementing the new processing system.
For the Supplemental Poverty Measure (SPM), the differences in 2017 overall poverty rates comparing the two processing systems were statistically significant and there were statistically significant differences for many demographic groups. Many of these differences are attributable to the improvements made in the imputation of medical-out-of-pocket expenses, housing subsidies and school lunch receipts.
Health Insurance
Based on over a decade of research, the Census Bureau introduced a redesigned health insurance questionnaire in the CPS ASEC in order to capture more timely and relevant information on the nation’s health insurance coverage while also minimizing respondent burden. Questionnaire changes included: (a) the addition of current coverage questions to improve responses to questions about health insurance coverage in the previous calendar year; (b) general coverage questions followed by more specific questions; (c) new questions to measure marketplace participation and employer offers and take up; and (d) health insurance unit design to capture household members sharing the same plan type.
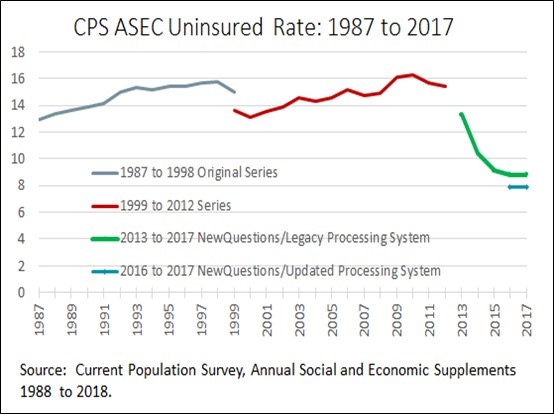
Given the numerous changes to the CPS ASEC health insurance questions and processing system, resulting in breaks in series for 1999, 2013 and 2017, the Census Bureau recommends that users rely on the American Community Survey for historical trends. Estimates from the updated CPS ASEC processing system should not be compared to estimates for 2013 to 2017 from the legacy processing system and these 2013 to 2017 estimates should not be compared to the previous 1999 to 2012 series or to the original 1987 to 1998 series. See Figure 5
The new processing system uses the additional detailed responses available from the new questionnaire to produce estimates of health insurance coverage, including information on plans that did not previously exist such as those purchased through the healthcare.gov marketplace. In addition, the new processing system improves the imputation of missing data by using new information on current and sub-annual coverage and grouping individuals into health insurance units. Data users are also able to distinguish between different types of military coverage, including TRICARE, CHAMPVA, and VACare.
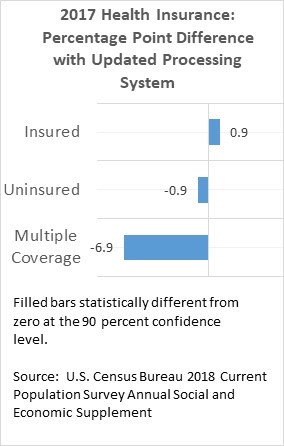
Estimates for 2017 from the updated processing system show a statistically significant increase in the percentage of people with health insurance coverage as compared to estimates from the legacy processing system. The percentage of people covered by multiple coverage types within the same calendar year was also significantly lower under the new processing system, primarily as a result of the improved imputation of missing data.
For more information on the impact of these changes, please visit census.gov where you can find links to the research data files and documentation, numerous working papers and presentations, and summary tables.
www.census.gov/data/datasets/time-series/demo/income-poverty/cps-asec-design.html
Working papers and presentations
- Berchick & Jackson. 2019. “Health Insurance Coverage in the 2017 CPS ASEC Research File.” SEHSD WP 2019-01.
- Berchick & Jackson. 2019. “Health Insurance Coverage in the Current Population Survey: Estimates from the 2017 Research File.” SEHSD WP 2019-02.
- Bee. 2019. “Are Bracket Responses Accurate? Using IRS W-2 Records to Assess Earnings Edits for the Redesigned CPS ASEC.” SEHSD WP 2019-22
- Berchick and Jackson. 2019. “Health Insurance Coverage in the United States: Evaluating the Effects of Changes in the CPS ASEC.” SEHSD WP 2019-25.
- Edwards & Creamer. 2019. “Updating the Current Population Survey Processing System and Bridging Differences in the Measurement of Poverty.” SEHSD WP 2019-05
- Fox & Mykyta. 2019. “The Supplemental Poverty Measure: Evaluating the Effects of Changes In in the CPS ASEC on Poverty Rates By Age Group.” SEHSD WP 2019-23
- Kreider & Gurrentz. 2019. “Changes to the Household Relationship Data in the Current Population Survey.” SEHSD-WP-2019-13
- Rothbaum. 2019. “Processing Changes to the Current Population Survey Annual Social and Economic Supplement.” SEHSD WP-2019-18
Files with technical documentation online
