2018 Data Measures Automation in U.S. Businesses
2018 Data Measures Automation in U.S. Businesses
Artificial intelligence (AI), robots, and other automation types are dramatically changing the way production occurs in U.S. businesses. To better understand these effects, the Census Bureau has started measuring companies’ use of robots through the Annual Survey of Manufactures (ASM) and the Annual Capital Expenditures Survey (ACES); and measuring the use of AI, cloud-hosting services, robots, and other technologies through the Annual Business Survey (ABS).
On June 23, 2020, the Census Bureau and New York University jointly hosted a video conference on automation in U.S. businesses. The Census Bureau highlighted 2018 survey findings and sought feedback for soon-to-be-released experimental data products from experts in the field. Over 50 representatives from government statistical agencies, academia, and the private sector attended.
The 2018 ASM (a sample survey of approximately 50,000 manufacturing establishments) included questions about industrial robotic expenditures, the number of new robots purchased, and the total stock of robots in operation. The National Science Foundation provided funding for the cognitive testing of these questions.
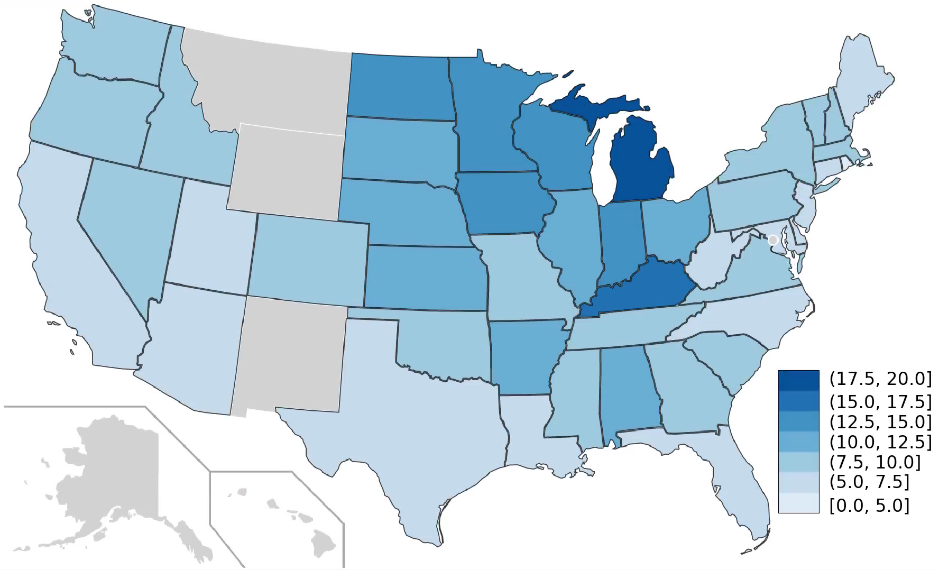
Based on responses to the mailout portion of the ASM survey, 2018 results indicate that establishments that adopt robots tend to be larger (as measured by establishment employment). There is evidence that most manufacturing industries in the U.S. have begun using robots, with the industrial Midwest boasting the largest concentration of establishments using them (see Figure 1).
Figure 1: Percentage of Plants Using Robots by State
Source: 2018 Annual Survey of Manufactures.
Notes: Estimates are preliminary and based only on respondents. Tests for statistical significance were not conducted.
Preliminary estimates show robot exposure rates – the share of workers in an industry employed in establishments with robots – were high, exceeding 30% in industries like transportation equipment, primary metal, and plastic and rubber products.
The ACES, a survey of capital expenditures of approximately 50,000 employer firms across all nonfarm sectors of the U.S. economy, asked about robotics expenditures and was collected at the firm level.
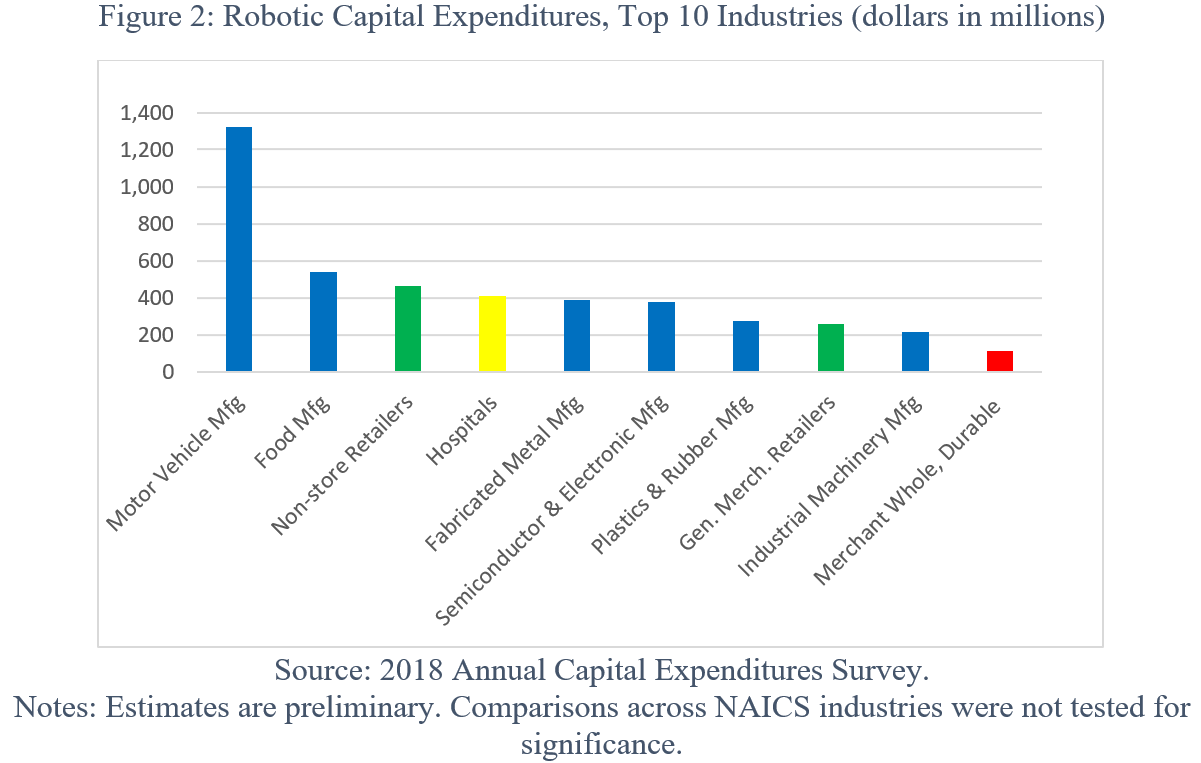
Initial findings from 2018 indicate companies that use robots tend to be larger (as measured by firm employment). The manufacturing sector had the highest total capital expenditures on robots and the highest average by firm. Non-store retail and hospitals were among other industries with high capital expenditures on robots (see Figure 2).
The ACES is the only survey that produces data on capital expenditures in the U.S. from a representative sample of firms across all economic sectors. Discussions to increase sample size and add a question on robot presence are ongoing.
The ABS, a survey of employer firms, included several questions on technologies used in 2018. Among them: whether firms use a range of cloud-based services (including servers, data storage, and data analysis), and business technologies (such as machine learning, machine vision, touchscreens, robotics, and others).
The 2018 survey found that all firms and sectors widely adopted digitization, and that diffusion was highest among older, larger firms. That use increased with size across all age categories. Cloud-based services were used for many different functions but were not as widely adopted. There was high variability in type and usage by sector, with manufacturing being the leading user of specific technologies such as machine learning, machine vision, and robotics.
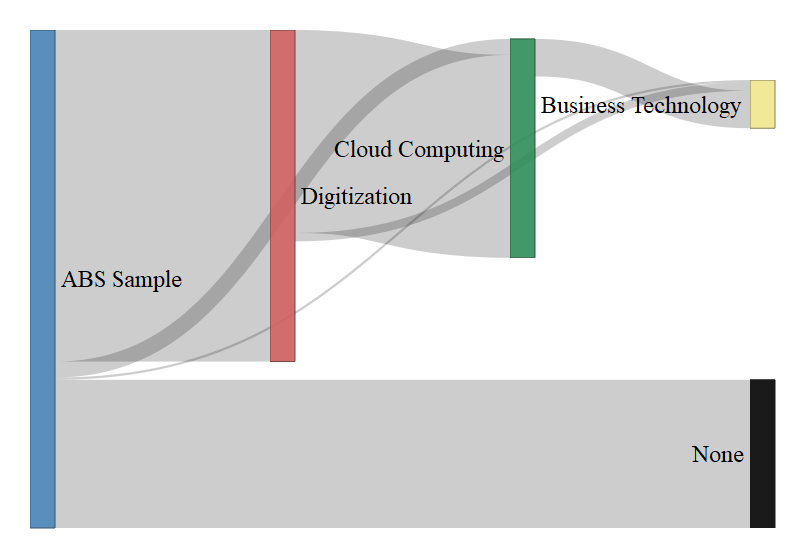
The ABS also found advanced technology adoption was highly dependent on the adoption of crucial infrastructure (see Figure 3).
Figure 3: Technological Hierarchies
Source: 2018 Annual Business Survey.
Since the video workshop, the ABS has released select data on technology in the 2018 ABS Technology Tables.
The Census Bureau will be releasing these experimental data products over the next year. Please visit the Measuring Technology and the Economy (Tech Stats) page to view survey questions and slides from the workshop. You will be able to access the experimental data products from the Tech Stats page when released, so be sure to check the site regularly for updates.
Javier Miranda is a Principal Economist in the Economy-Wide Statistics Division of the U.S. Census Bureau. Rob Seamans is an Associate Professor at New York University's Stern School of Business.
The Census Bureau has reviewed the data product for unauthorized disclosure of confidential information and has approved the disclosure avoidance practices applied. (ASM Approval ID: CBDRB-FY20-312, ACES Approval IDs: CBDRB-FY20-322 and CBDRB-FY20-323, ABS Approval ID: CBDRB-FY20-095)


