Halloween: October 31, 2023
Dating back 2,000 years to the Celtic festival of Samhain, Halloween has evolved into a celebration characterized by child-friendly activities like dressing in costumes, trick-or-treating and carving pumpkins.
The following facts are made possible by the invaluable responses to U.S. Census Bureau surveys. We appreciate the public’s cooperation as we continuously measure America’s people, places and economy.
Trick or Treat!
128.5 million
The number of occupied U.S. housing units – potential stops for trick-or-treaters – in 2021.
Source:
72.4 million
The estimated number of U.S. children under age 18 (read: potential trick-or-treaters) as of July 1, 2022.
Source:
60.6 million
The number of occupied U.S. housing units with steps that trick-or-treaters had to climb to collect their treats – or tricks – in 2021.
Sweet Economic Statistics
3,227
The number of U.S. confectionery and nut stores in 2021.
Source:
726
The number of U.S. formal wear and costume rental establishments in 2021.
Source:
255
The number of U.S. establishments that primarily produced products from cocoa beans in 2021.
Source:
*The County Business Patterns data above represents establishments with employees.
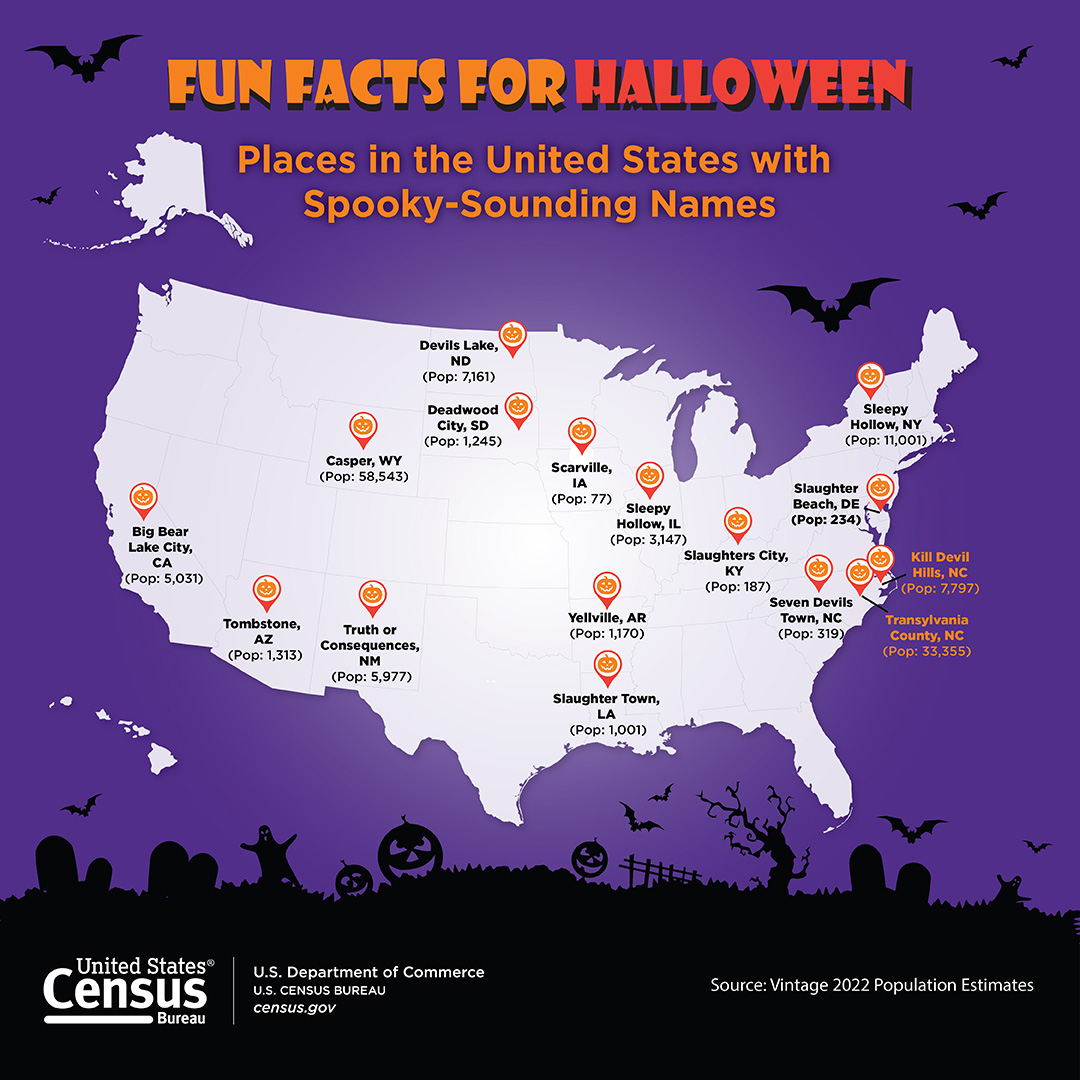
Spooky-Sounding Spots
Big Bear Lake City, Calif. (2022 population: 5,031)
Casper, Wyo. (2022 population: 58,543)
Devils Lake, N.D. (2022 population: 7,161)
Deadwood City, S.D. (2022 population: 1,245)
Kill Devil Hills, N.C. (2022 population: 7,797)
Scarville, Iowa (2022 population: 77)
Seven Devils Town, N.C. (2022 population: 319)
Slaughter Beach, Del. (2022 population: 234)
Slaughter Town, La. (2022 population: 1,001)
Slaughters City, Ky. (2022 population: 187)
Sleepy Hollow, Ill. (2022 population: 3,147)
Sleepy Hollow, N.Y. (2022 population: 11,001)
Tombstone, Ariz. (2022 population: 1,313)
Transylvania County, N.C. (2022 population: 33,355)
Truth or Consequences, N.M. (2022 population: 5,977)
Yellville, Ark. (2022 population: 1,170)
Editor’s note: The preceding data were collected from a variety of sources and may be subject to sampling variability and other sources of error.
Previous Facts for Features
Editor’s note: The preceding data were collected from a variety of sources and may be subject to sampling variability and other sources of error.
###
Observances in our Facts for Features series:
- National Black History Month (February)
- Women's History Month (March)
- Irish-American Heritage Month (March)
- Asian American and Pacific Islander Heritage Month (May)
- The Fourth of July
- Anniversary of Americans With Disabilities Act (July 26)
- National Hispanic Heritage Month (Sept. 15 – Oct. 15)
- Halloween (Oct. 31)
- National Native American Heritage Month (November)
- Veterans Day (Nov. 11)
- Holiday Season (November — December)
Editor’s note: These data come from a variety of sources and may be subject to sampling variability and other sources of error. We generally release Facts for Features about two months before observances to accommodate magazine production timelines. For more information, contact the Census Bureau’s Public Information Office at (301)763-3030 or <[email protected]>.
Profile America's Facts for Features provides statistics related to observances and holidays not covered by Stats for Stories. For observances not listed above, visit our Stats for Stories webpage.
Stats for Stories provides links to timely story ideas highlighting newsworthy Census Bureau statistics that relate to current events, observances, holidays and anniversaries. The story ideas are intended to assist the media in story mining and producing content for their audiences. Dates with presidential proclamations are marked with (P).


