New Census Bureau Estimates Show Counties in South and West Lead Nation in Population Growth
For Immediate Release: Thursday, April 18, 2019
New Census Bureau Estimates Show Counties in South and West Lead Nation in Population Growth
Texas Counties Take Four of the Top Ten Spots in Numeric Growth
APRIL 18, 2019 — Counties with the largest numeric growth are all located in the south and the west, with counties in Texas taking four out of the top 10 spots according to new U.S. Census Bureau population estimates released today. By metropolitan area, Dallas-Fort Worth-Arlington, Texas, had the largest numeric growth with a gain of 131,767 (1.8 percent) in 2018, followed by Phoenix-Mesa-Scottsdale, Ariz. with an increase of 96,268 (2.0 percent). Migration, both domestic and international, as well as natural increase contributed to the growth in each of these areas, with natural increase serving as the largest source of population growth in Dallas and domestic migration serving as the largest source in Phoenix.
“One interesting trend we are seeing this year is that metro areas not among the most populous are ranked in the top 10 for population growth,” said Sandra Johnson, a demographer in the Census Bureau’s Population Division. “Though no new metro areas moved into the top 10 largest areas, Phoenix, Seattle, Austin, and Orlando all experienced numeric increases in population since 2010, rivaling growth in areas with much larger populations. This trend is consistent with the overall growth we are seeing in the south and the west.”
Among counties with a population of 20,000 or more, Williams County, N.D., was the fastest-growing county by percentage, increasing by 5.9 percent between 2017 and 2018 (from 33,395 to 35,350). The rapid growth Williams County, N.D., experienced was due mainly to net domestic migration (1,471) in 2018. The county also grew between 2017 and 2018 by natural increase (427) and international migration (52).
Of the other nine fastest-growing counties, all experienced positive domestic migration. All but Brunswick, N.C., and Hood, Texas, experienced growth through natural increase (having more births than deaths), and only Brunswick, N.C., had negative net international migration.
The statistics released today provide population estimates, rankings and components of change for the nation’s 390 metropolitan statistical areas, 555 micropolitan statistical areas, and 3,142 counties, as well as population estimates and rankings for Puerto Rico’s 78 municipios.
Additional Highlights:
Counties
Growth and decline:
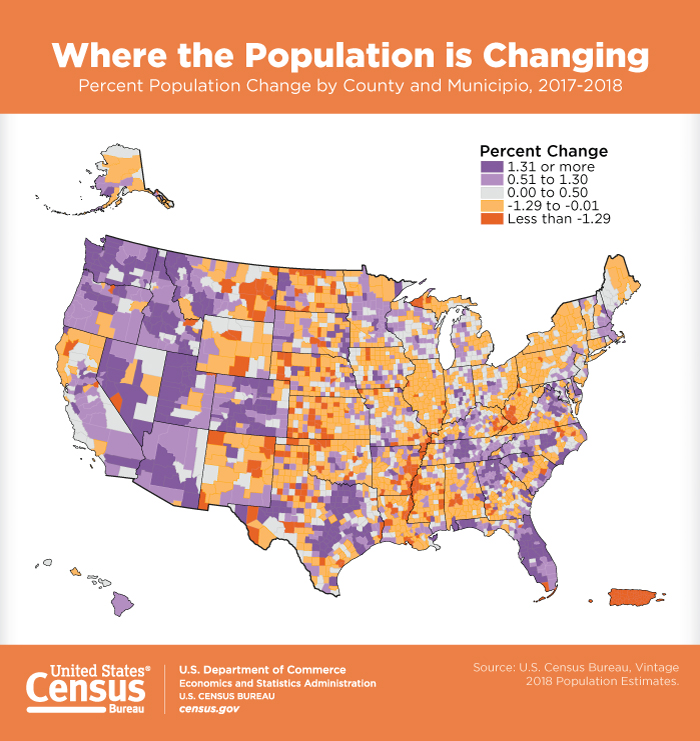
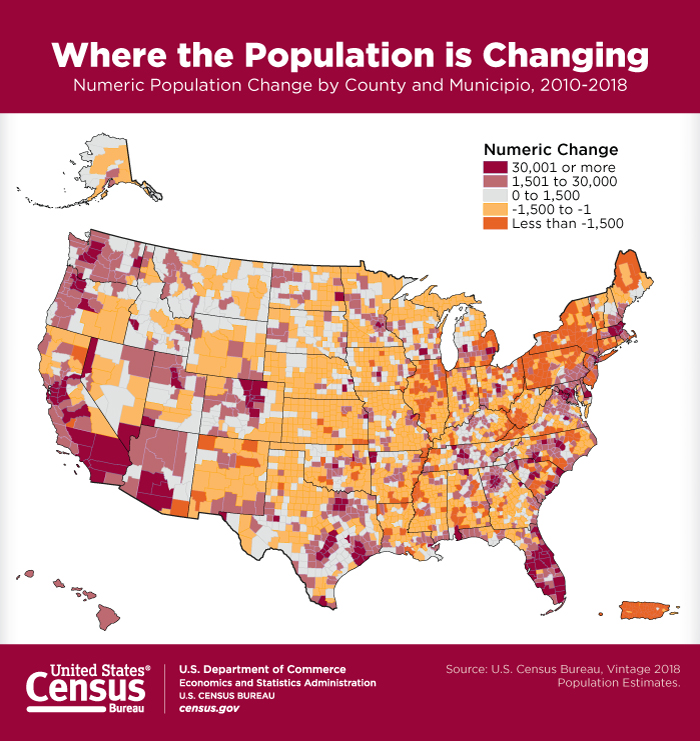
- Out of 3,142 counties, 1,739 (55.3 percent) gained population between 2017 and 2018. Twelve counties (0.4 percent) experienced no change in population during this time, while the remaining 1,391 (44.3 percent) lost population.
- Between 2010 and 2018, 1,481 (47.1 percent) counties gained population and 1,661 (52.9 percent) lost population.
Natural increase:
- Out of 3,142 counties, 1,757 (55.9 percent) counties experienced natural increase in 2018. This is down from 1,858 (59.1 percent) in 2017.
Total net migration:
- Out of 3,142 counties, 1,640 (52.2 percent) counties showed positive total net migration in 2018, meaning more people moved into the county than moved out. This is roughly equivalent to the number of counties with positive net migration in 2017 (1,641 or 52.2 percent).
Municipios
- Between 2017 and 2018, all 78 municipios in Puerto Rico decreased in population. Between 2010 and 2018, all but one municipio lost population. Gurabo Municipio increased from 45,371 in 2010 to 46,068 in 2018, a gain of 697 residents (1.5 percent).
- The largest numeric population decreases between 2017 and 2018 were in San Juan Municipio at -15,123 (-4.5 percent), followed by Bayamón Municipio (-8,013; -4.5 percent) and Ponce Municipio (-6,705; -4.8 percent).
- Among municipios with a population of 20,000 or more, the largest percent population decreases between 2017 and 2018 were in Lares Municipio at -4.8 percent (-1,242), followed by Ponce Municipio (-6,705; -4.8 percent) and Fajardo Municipio (-1,456; -4.7 percent).
Metropolitan Areas
Growth:
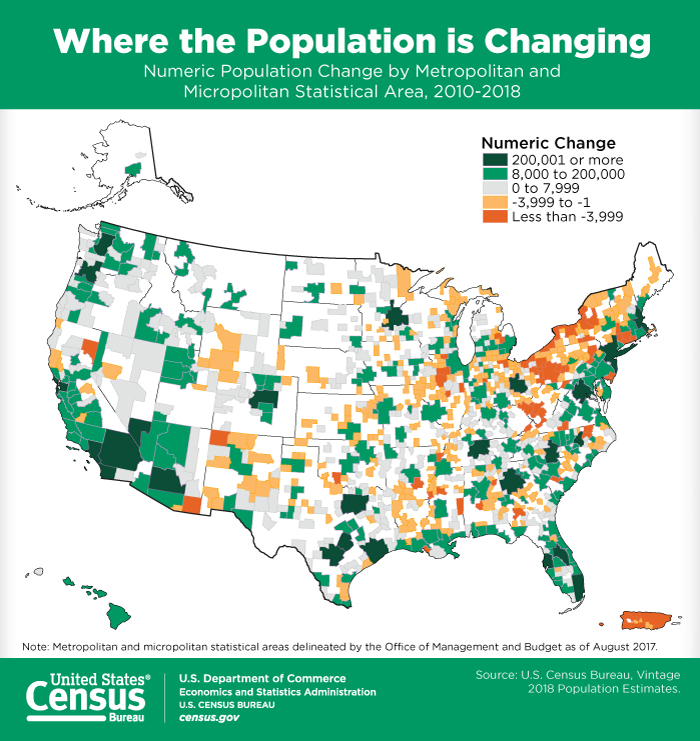
- Two of the 10 fastest-growing metro areas in 2018 are in Texas: Midland, Texas (first), with a growth of 4.3 percent (7,383) and Odessa, Texas (fifth), with a growth of 3.2 percent (4,951). Positive domestic migration contributed to the growth in both areas. Florida and Utah also each contains two of the fastest-growing metro areas in 2018.
Decline:
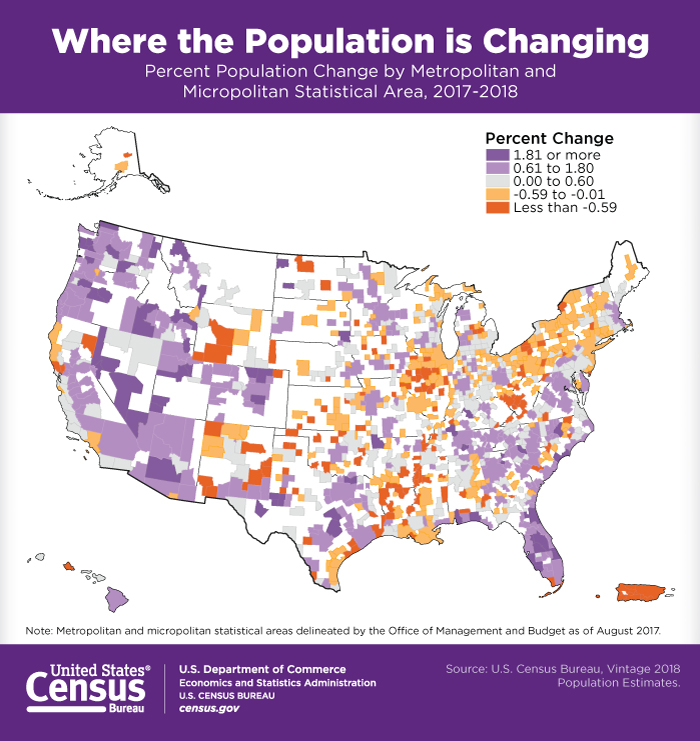
- Of the 390 metro areas within the 50 states, the District of Columbia, and Puerto Rico, 102 (26.2 percent) experienced population decline in 2018.
- All metro areas within Puerto Rico decreased between 2017 and 2018, including Ponce, Puerto Rico (-4.6 percent); Mayagüez, Puerto Rico (-4.3 percent); Aguadilla-Isabela, Puerto Rico (-4.0 percent); San Juan-Carolina-Caguas, Puerto Rico (-3.9 percent); and Guayama, Puerto Rico (-3.8 percent).
- The five fastest-decreasing metro areas (excluding those within Puerto Rico) were Charleston, W.Va. (-1.6 percent); Pine Bluff, Ark. (-1.5 percent); Farmington, N.M. (-1.5 percent); Danville, Ill. (-1.2 percent); and Watertown-Fort Drum, N.Y. (-1.2 percent). The population decreases were primarily due to negative net domestic migration.
Micropolitan Areas
- Of the 555 micropolitan areas, 267 (48.1 percent) gained population between 2017 and 2018. Since 2010, 256 (46.1 percent) have gained population.
In the coming months, the Census Bureau will release 2018 population estimates for cities and towns, national, state- and county-level housing unit estimates, as well as national, state and county population estimates by age, sex, race and Hispanic origin.
| Rank | State | County |
April 1, 2010 (Estimates base) |
July 1, 2017 | July 1, 2018 |
|---|---|---|---|---|---|
| 1 | California | Los Angeles County | 9,818,672 | 10,118,759 | 10,105,518 |
| 2 | Illinois | Cook County | 5,195,026 | 5,204,502 | 5,180,493 |
| 3 | Texas | Harris County | 4,093,188 | 4,664,159 | 4,698,619 |
| 4 | Arizona | Maricopa County | 3,817,359 | 4,329,580 | 4,410,824 |
| 5 | California | San Diego County | 3,095,349 | 3,325,468 | 3,343,364 |
| 6 | California | Orange County | 3,010,274 | 3,179,950 | 3,185,968 |
| 7 | Florida | Miami-Dade County | 2,498,013 | 2,744,878 | 2,761,581 |
| 8 | Texas | Dallas County | 2,366,683 | 2,622,799 | 2,637,772 |
| 9 | New York | Kings County | 2,504,717 | 2,596,385 | 2,582,830 |
| 10 | California | Riverside County | 2,189,765 | 2,417,224 | 2,450,758 |
| Rank | State | County |
April 1, 2010 (Estimates base) |
July 1, 2017 | July 1, 2018 | Numeric Growth |
|---|---|---|---|---|---|---|
| 1 | Arizona | Maricopa County | 3,817,359 | 4,329,580 | 4,410,824 | 81,244 |
| 2 | Nevada | Clark County | 1,951,271 | 2,183,310 | 2,231,647 | 48,337 |
| 3 | Texas | Harris County | 4,093,188 | 4,664,159 | 4,698,619 | 34,460 |
| 4 | Texas | Collin County | 782,220 | 971,393 | 1,005,146 | 33,753 |
| 5 | California | Riverside County | 2,189,765 | 2,417,224 | 2,450,758 | 33,534 |
| 6 | Washington | King County | 1,931,292 | 2,204,229 | 2,233,163 | 28,934 |
| 7 | Florida | Orange County | 1,145,954 | 1,352,933 | 1,380,645 | 27,712 |
| 8 | Texas | Tarrant County | 1,810,655 | 2,057,468 | 2,084,931 | 27,463 |
| 9 | Texas | Bexar County | 1,714,772 | 1,958,841 | 1,986,049 | 27,208 |
| 10 | Florida | Hillsborough County | 1,229,178 | 1,410,115 | 1,436,888 | 26,773 |
| Rank | State | County |
April 1, 2010 (Estimates base) |
July 1, 2017 | July 1, 2018 | Percent Growth |
|---|---|---|---|---|---|---|
| 1 | North Dakota | Williams County | 22,399 | 33,395 | 35,350 | 5.9 |
| 2 | Texas | Comal County | 108,485 | 140,790 | 148,373 | 5.4 |
| 3 | Texas | Kaufman County | 103,363 | 122,845 | 128,622 | 4.7 |
| 4 | North Carolina | Brunswick County | 107,429 | 130,735 | 136,744 | 4.6 |
| 5 | Florida | Walton County | 55,043 | 68,275 | 71,375 | 4.5 |
| 6 | Texas | Midland County | 136,872 | 165,386 | 172,578 | 4.3 |
| 7 | Florida | Osceola County | 268,683 | 352,661 | 367,990 | 4.3 |
| 8 | Florida | St. Johns County | 190,034 | 243,928 | 254,261 | 4.2 |
| 9 | Texas | Hood County | 51,163 | 58,154 | 60,537 | 4.1 |
| 10 | Georgia | Jackson County | 60,457 | 67,716 | 70,422 | 4.0 |
| Rank | State | County |
April 1, 2010 (Estimates base) |
July 1, 2017 | July 1, 2018 | Numeric Growth |
|---|---|---|---|---|---|---|
| 1 | Texas | Harris County | 4,093,188 | 4,664,159 | 4,698,619 | 605,431 |
| 2 | Arizona | Maricopa County | 3,817,359 | 4,329,580 | 4,410,824 | 593,465 |
| 3 | Washington | King County | 1,931,292 | 2,204,229 | 2,233,163 | 301,871 |
| 4 | California | Los Angeles County | 9,818,672 | 10,118,759 | 10,105,518 | 286,846 |
| 5 | Nevada | Clark County | 1,951,271 | 2,183,310 | 2,231,647 | 280,376 |
| 6 | Texas | Tarrant County | 1,810,655 | 2,057,468 | 2,084,931 | 274,276 |
| 7 | Texas | Bexar County | 1,714,772 | 1,958,841 | 1,986,049 | 271,277 |
| 8 | Texas | Dallas County | 2,366,683 | 2,622,799 | 2,637,772 | 271,089 |
| 9 | Florida | Miami-Dade County | 2,498,013 | 2,744,878 | 2,761,581 | 263,568 |
| 10 | California | Riverside County | 2,189,765 | 2,417,224 | 2,450,758 | 260,993 |
| Rank | State | County |
April 1, 2010 (Estimates base) |
July 1, 2017 | July 1, 2018 | Percent Growth |
|---|---|---|---|---|---|---|
| 1 | North Dakota | Williams County | 22,399 | 33,395 | 35,350 | 57.8 |
| 2 | Texas | Hays County | 157,099 | 214,277 | 222,631 | 41.7 |
| 3 | Utah | Wasatch County | 23,525 | 31,975 | 33,240 | 41.3 |
| 4 | Florida | Sumter County | 93,420 | 124,933 | 128,754 | 37.8 |
| 5 | Florida | Osceola County | 268,683 | 352,661 | 367,990 | 37.0 |
| 6 | Texas | Comal County | 108,485 | 140,790 | 148,373 | 36.8 |
| 7 | Texas | Kendall County | 33,411 | 43,984 | 45,641 | 36.6 |
| 8 | Iowa | Dallas County | 66,138 | 87,215 | 90,180 | 36.4 |
| 9 | Georgia | Forsyth County | 175,511 | 228,588 | 236,612 | 34.8 |
| 10 | Texas | Fort Bend County | 584,690 | 766,136 | 787,858 | 34.7 |
| Rank | Name |
April 1, 2010 (Estimates base) |
July 1, 2017 | July 1, 2018 |
|---|---|---|---|---|
| 1 | New York-Newark-Jersey City, NY-NJ-PA | 19,566,527 | 19,998,951 | 19,979,477 |
| 2 | Los Angeles-Long Beach-Anaheim, CA | 12,828,946 | 13,298,709 | 13,291,486 |
| 3 | Chicago-Naperville-Elgin, IL-IN-WI | 9,461,539 | 9,520,784 | 9,498,716 |
| 4 | Dallas-Fort Worth-Arlington, TX | 6,426,222 | 7,407,944 | 7,539,711 |
| 5 | Houston-The Woodlands-Sugar Land, TX | 5,920,487 | 6,905,695 | 6,997,384 |
| 6 | Washington-Arlington-Alexandria, DC-VA-MD-WV | 5,636,363 | 6,200,001 | 6,249,950 |
| 7 | Miami-Fort Lauderdale-West Palm Beach, FL | 5,566,294 | 6,149,687 | 6,198,782 |
| 8 | Philadelphia-Camden-Wilmington, PA-NJ-DE-MD | 5,965,705 | 6,078,451 | 6,096,372 |
| 9 | Atlanta-Sandy Springs-Roswell, GA | 5,286,750 | 5,874,249 | 5,949,951 |
| 10 | Boston-Cambridge-Newton, MA-NH | 4,552,598 | 4,844,597 | 4,875,390 |
| Rank | Name |
April 1, 2010 (Estimates base) |
July 1, 2017 | July 1, 2018 | Numeric Growth |
|---|---|---|---|---|---|
| 1 | Dallas-Fort Worth-Arlington, TX | 6,426,222 | 7,407,944 | 7,539,711 | 131,767 |
| 2 | Phoenix-Mesa-Scottsdale, AZ | 4,193,127 | 4,761,694 | 4,857,962 | 96,268 |
| 3 | Houston-The Woodlands-Sugar Land, TX | 5,920,487 | 6,905,695 | 6,997,384 | 91,689 |
| 4 | Atlanta-Sandy Springs-Roswell, GA | 5,286,750 | 5,874,249 | 5,949,951 | 75,702 |
| 5 | Orlando-Kissimmee-Sanford, FL | 2,134,402 | 2,512,917 | 2,572,962 | 60,045 |
| 6 | Seattle-Tacoma-Bellevue, WA | 3,439,805 | 3,884,469 | 3,939,363 | 54,894 |
| 7 | Austin-Round Rock, TX | 1,716,321 | 2,115,230 | 2,168,316 | 53,086 |
| 8 | Riverside-San Bernardino-Ontario, CA | 4,224,966 | 4,570,427 | 4,622,361 | 51,934 |
| 9 | Tampa-St. Petersburg-Clearwater, FL | 2,783,462 | 3,091,225 | 3,142,663 | 51,438 |
| 10 | Washington-Arlington-Alexandria, DC-VA-MD-WV | 5,636,363 | 6,200,001 | 6,249,950 | 49,949 |
| Rank | Name |
April 1, 2010 (Estimates base) |
July 1, 2017 | July 1, 2018 | Percent Growth |
|---|---|---|---|---|---|
| 1 | Midland, TX | 141,671 | 170,948 | 178,331 | 4.3 |
| 2 | Myrtle Beach-Conway-North Myrtle Beach, SC-NC | 376,555 | 463,386 | 480,891 | 3.8 |
| 3 | St. George, UT | 138,115 | 165,859 | 171,700 | 3.5 |
| 4 | Lakeland-Winter Haven, FL | 602,098 | 685,830 | 708,009 | 3.2 |
| 5 | Odessa, TX | 137,136 | 157,173 | 162,124 | 3.2 |
| 6 | The Villages, FL | 93,420 | 124,933 | 128,754 | 3.1 |
| 7 | Greeley, CO | 252,847 | 305,274 | 314,305 | 3.0 |
| 8 | Boise City, ID | 616,566 | 710,080 | 730,426 | 2.9 |
| 9 | Bend-Redmond, OR | 157,730 | 186,807 | 191,996 | 2.8 |
| 10 | Provo-Orem, UT | 526,885 | 617,751 | 633,768 | 2.6 |
| Rank | Name |
April 1, 2010 (Estimates base) |
July 1, 2017 | July 1, 2018 | Numeric Growth |
|---|---|---|---|---|---|
| 1 | Dallas-Fort Worth-Arlington, TX | 6,426,222 | 7,407,944 | 7,539,711 | 1,113,489 |
| 2 | Houston-The Woodlands-Sugar Land, TX | 5,920,487 | 6,905,695 | 6,997,384 | 1,076,897 |
| 3 | Phoenix-Mesa-Scottsdale, AZ | 4,193,127 | 4,761,694 | 4,857,962 | 664,835 |
| 4 | Atlanta-Sandy Springs-Roswell, GA | 5,286,750 | 5,874,249 | 5,949,951 | 663,201 |
| 5 | Miami-Fort Lauderdale-West Palm Beach, FL | 5,566,294 | 6,149,687 | 6,198,782 | 632,488 |
| 6 | Washington-Arlington-Alexandria, DC-VA-MD-WV | 5,636,363 | 6,200,001 | 6,249,950 | 613,587 |
| 7 | Seattle-Tacoma-Bellevue, WA | 3,439,805 | 3,884,469 | 3,939,363 | 499,558 |
| 8 | Los Angeles-Long Beach-Anaheim, CA | 12,828,946 | 13,298,709 | 13,291,486 | 462,540 |
| 9 | Austin-Round Rock, TX | 1,716,321 | 2,115,230 | 2,168,316 | 451,995 |
| 10 | Orlando-Kissimmee-Sanford, FL | 2,134,402 | 2,512,917 | 2,572,962 | 438,560 |
| Rank | Name |
April 1, 2010 (Estimates base) |
July 1, 2017 | July 1, 2018 | Percent Growth |
|---|---|---|---|---|---|
| 1 | The Villages, FL | 93,420 | 124,933 | 128,754 | 37.8 |
| 2 | Myrtle Beach-Conway-North Myrtle Beach, SC-NC | 376,555 | 463,386 | 480,891 | 27.7 |
| 3 | Austin-Round Rock, TX | 1,716,321 | 2,115,230 | 2,168,316 | 26.3 |
| 4 | Midland, TX | 141,671 | 170,948 | 178,331 | 25.9 |
| 5 | St. George, UT | 138,115 | 165,859 | 171,700 | 24.3 |
| 6 | Greeley, CO | 252,847 | 305,274 | 314,305 | 24.3 |
| 7 | Cape Coral-Fort Myers, FL | 618,754 | 739,506 | 754,610 | 22.0 |
| 8 | Bend-Redmond, OR | 157,730 | 186,807 | 191,996 | 21.7 |
| 9 | Orlando-Kissimmee-Sanford, FL | 2,134,402 | 2,512,917 | 2,572,962 | 20.5 |
| 10 | Raleigh, NC | 1,130,488 | 1,334,342 | 1,362,540 | 20.5 |
###
Contact
Julie Iriondo
Public Information Office
301-763-3030
[email protected]
Related Information
