Enterprise Statistics Program (ESP) Methodology
Enterprise Statistics Program (ESP) Methodology
Overview
The Enterprise Statistics Program (ESP) collects enterprise level data from the Report of Organization Survey (also known as the Company Organization Survey or COS). The COS is an annual survey whose purpose is to obtain current organization and operating information on large multi-establishment enterprises in order to maintain the Business Register (BR). The BR is a multi-relational database that contains a record for each establishment that is located in the U.S. or Puerto Rico and has employees. During Economic Census years (years that end with 2 or 7), the COS is expanded to cover all multi-establishment enterprises (large and small) and is conducted jointly with the Economic Census to reduce respondent burden. See the Report of Organization for further information.
The Enterprise Statistics Program provides key measures of comprehensive company-wide data, including company support organization and selected financial activities. The enterprise-level data is useful in various economic programs. Researchers use the data to study trends in enterprises over time.
Historical Information
The Enterprise Statistics Program was discontinued after 1992. No publications are available between 1992 and 2007. Please note that the data are not comparable between survey periods. Refer to the methodology section of each publication for more information. After evaluation studies using 2007 and 2011 data, the program was reinstituted with the 2012 Economic Census. See ESP Historical Data for further information.
Industry Coverage
2012 Enterprise Statistics data are published according to the 2012 North American Industry Classification System (NAICS). NAICS was first adopted in the United States, Canada, and Mexico in 1997 to facilitate the comparison of industrial statistics between the three countries.
The Enterprise Statistics Program (ESP) covers all or part of the following NAICS sectors (exclusions are shown in Table 2):
Table 1: Sector In-Scope to the Enterprise Statistics Program
Notes: Selected activities of governments are also in-scope, such as hospitals, liquor stores, and university press publishers.
Excluded Industries
Table 2 lists the industries that are out-of-scope to the 2012 Enterprise Statistics Program.
Table 2: Industries that are Out-of-Scope to the ESP
NAICS |
Description of Excluded Industry |
11 |
Agriculture |
482 |
Rail Transportation |
491 |
Postal Service |
521 |
Monetary Authorities - Central Banks (1) |
525 |
Funds, Trusts, and Other Financial Vehicles |
55 |
Management of Companies and Enterprises |
6111 |
Elementary and Secondary Schools |
6112 |
Junior Colleges |
6113 |
Colleges, Universities, and Professional Schools |
8131 |
Religious Organizations |
81393 |
Labor Unions and Similar Labor Organizations |
81394 |
Political Organizations |
81399 |
Other Similar Organizations (except Business, Professional, Labor, and Political Organizations) |
814 |
Private Households |
92 |
Public Administration |
Notes: (1) This is the only industry included in the 2012 Economic Census that is not included in the 2012 ESP.
Enterprise Classification
An enterprise may have establishments in many different industries. For the purpose of the 2012 ESP, an enterprise was classified into a single sector based on the sector with the largest share of the enterprise’s payroll. For example, an enterprise with $300 million in payroll from establishments in sector 52 and $250 million in payroll from establishments in sector 62 would be classified into sector 52. For the ESP, this enterprise and all of its revenue, payroll ($550 million in this example), or any other data would all be tabulated in sector 52. This enterprise would not contribute anything to sector 62.
Sample Design
The 2012 ESP sample is a representative sample of all employer enterprises with operations in the U.S. It consists of two components: (1) All multi-establishment enterprises, and (2) a sample of single-establishment enterprises.
Multi-establishment enterprises must have at least one establishment that meets all of the following conditions to be included in the ESP:
- Be classified in an in-scope industry,
- Not be classified as an auxiliary establishment or in NAICS sector 55,
- Not be classified as a manufacturer’s sales branch or office, and
- Is located in the 50 states and the District of Columbia
Single-establishment enterprises must meet all of the following conditions to be included in the ESP sampling frame:
- Be classified in an in-scope industry,
- Not be classified as an auxiliary establishment or in NAICS sector 55,
- Is located in the 50 states and the District of Columbia, and
- Have 2012 payroll greater than zero
For single-establishments, the ESP sample is a subsample of the single-establishment enterprises selected into the 2012 Economic Census sample. The ESP sample was stratified by the Enterprise Classification System Industry. Table 3 summarizes the sample sizes for these two components by sector. (Note: Subsequent to sample selection, the ESP program discontinued using the Enterprise Classification System that was used for the 2011 and earlier data products. Instead, the standard NAICS classification system was used. For enterprise statistics, the most detailed industry estimates provided are at the 4-digit NAICS level.)
Table 3: Summary of 2012 ESP Sampling Results
Sector |
Multi-Establishment Enterprise Frame & Sample Size |
Single-establishment Enterprises |
Total Sample Size |
|
Frame |
Sample Size |
|||
21 |
877 |
18,991 |
557 |
1,434 |
22 |
703 |
4,805 |
388 |
1,091 |
23 |
3,350 |
598,948 |
5,975 |
9,325 |
31-33 |
12,616 |
230,178 |
19,281 |
31,897 |
42 |
16,019 |
269,816 |
12,349 |
28,368 |
44-45 |
24,136 |
599,220 |
11,932 |
36,068 |
48-49 |
4,067 |
151,548 |
4,502 |
8,569 |
51 |
3,126 |
61,239 |
3,519 |
6,645 |
52 |
12,996 |
214,079 |
4,965 |
17,961 |
53 |
5,362 |
241,089 |
4,048 |
9,410 |
54 |
11,753 |
700,671 |
14,395 |
26,148 |
56 |
5,231 |
296,020 |
10,046 |
15,277 |
61 |
1,078 |
55,854 |
1,046 |
2,124 |
62 |
23,206 |
588,021 |
13,527 |
36,733 |
71 |
1,921 |
103,934 |
3,952 |
5,873 |
72 |
15,254 |
456,825 |
5,382 |
20,636 |
81 |
7,875 |
439,609 |
5,342 |
13,217 |
Total |
149,570 |
5,030,847 |
121,300 |
270,870 |
Note: Enterprises, known to consist of multiple establishments at the time of questionnaire mailout, were included in the ESP sample with certainty. Therefore, the multi-establishment frame and sample are identical.
Every enterprise included in the 2012 ESP sample was assigned a sample weight, which is the reciprocal of the probability of selection. For multi-establishment enterprises, this weight is always 1.0. For single-establishment enterprises, this weight ranges from 1.0 to 914.
Data Collection
Each enterprise selected into the 2012 ESP sample was mailed a questionnaire. These enterprises were asked to provide the following information about each of the enterprise’s operations:
- Foreign ownership or control,
- Foreign affiliation,
- Research and development expenses,
- Operating revenues,
- Royalties and license fees for the use of intellectual property,
- Percentage of revenue from manufacturing operations, and
- Contract manufacturing services.
During data collection, some sampled enterprises were determined to be out-of-scope to the ESP and were dropped from the set of enterprises actually tabulated to produce the estimates.
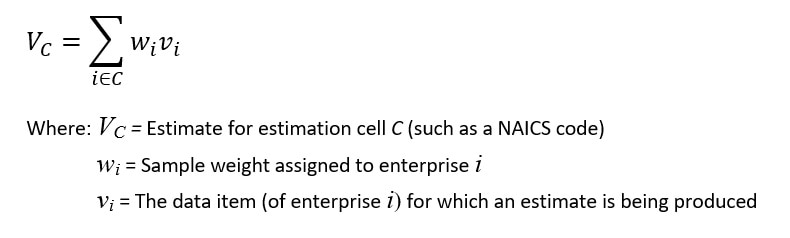
Estimation
Estimated totals (e.g., receipts, payroll, etc.) are produced as the sum of weighted data (reported or imputed) of the enterprises in the particular cell (combination of enterprise characteristics such as NAICS or size) being estimated.
Basis of Reporting
Enterprise Statistics data are tabulated at the enterprise level using data obtained from the Report of Organization Survey (COS), the 2012 Economic Census, Statistics of U.S. Business (SUSB), and County Business Patterns (CBP). Data are collected from each enterprise with U.S. operations (located in the 50 states and the District of Columbia). In some of these programs, data are collected at the business establishment level and are consolidated to the enterprise level for use by ESP. Enterprises with foreign operations or operations in Puerto Rico and other U.S. territories are instructed to exclude those data from their reports.
Level of Geographic Detail
Establishments for an enterprise can be located in more than one state or other level of geography. As a result, enterprise statistics are not shown below the U.S. level.
Reliability of Estimates
The published estimates may differ from the actual, but unknown, population values. For a particular estimate, statisticians define this difference as the total error of the estimate. When describing the accuracy of survey results, it is convenient to discuss total error as the sum of sampling error and non-sampling error. Sampling error is the error arising from the use of a sample, rather than a census, to estimate population values. Non-sampling error encompasses all other factors that contribute to the total error of a sample survey estimate. The sampling error of an estimate can usually be estimated from the sample; whereas, the non-sampling error of an estimate is difficult to measure and can rarely be estimated. Data users should take into account the estimates of sampling error and the potential effects of non-sampling error when using the published estimates.
The sampling error of the estimates in this publication can be estimated from the selected sample because the sample was selected using probability sampling. Common measures related to sampling error are the sampling variance, the standard error, and the relative standard error (RSE) or coefficient of variation (CV). The sampling variance is the squared difference, averaged over all possible samples of the same size and design, between the estimator and its average value. The standard error is the square root of the sampling variance. The CV and RSE express the standard error as a percentage of the estimate to which it refers.
Non-sampling errors are difficult to measure and can be introduced through inadequacies in the questionnaire, non-response, inaccurate reporting by respondents, errors in the application of survey procedures, incorrect recording of answers, and errors in data entry and processing. In conducting the 2012 ESP, every effort has been made to minimize the effect of non-sampling errors on the estimates.
Sampling Error
Sampling error occurs because data are requested from a sample instead of a complete enumeration of establishments in the population. The sample selected for each sector is one of many probability samples that could have been selected under identical circumstances. Each of the possible samples would yield a different set of estimates. Common measures of the variability among these estimates are the sampling variance, the standard error, and the relative standard error (RSE) or coefficient of variation (CV). A relative standard error is an expression of the standard error as a percent of the quantity being estimated. It is important to note that the standard error only measures sampling variability. It does not measure systematic biases of the sample. The Census Bureau recommends that individuals using estimates contained in this report incorporate this information into their analyses, as sampling error could affect the conclusions drawn from these estimates.
An estimate from a particular sample and the standard error associated with the estimate can be used to construct a confidence interval. A confidence interval is a range about a given estimator that has a specified probability of containing the result of a complete enumeration of the sampling frame conducted under the same survey conditions. Associated with each interval is a percentage of confidence, which is interpreted as follows. If, for each possible sample, an estimate of a population parameter and its approximate standard error were obtained, then:
- For approximately 90 percent of the possible samples, the interval from 1.645 standard errors below to 1.645 standard errors above the estimate would include the result as obtained from a complete enumeration of the sampling frame conducted under the same survey conditions.
- For approximately 95 percent of the possible samples, the interval from 1.960 standard errors below to 1.96 standard errors above the estimate would include the result as obtained from a complete enumeration of the sampling frame conducted under the same survey conditions. The 1.645 and 1.960 values, used to compute the 90% and 95% confidence intervals, are taken from the normal distribution and assumes that there are many contributing enterprises to the estimate. For computing confidence intervals for estimates with few contributing enterprises, the t-distribution with N – 1 degrees of freedom should be used, where N is the number of enterprises contributing to the particular estimate.
To illustrate the computation of a confidence interval for an estimate of receipts, assume that an estimate of receipts is $10,750 million and the relative standard error (RSE) for this estimate is 1.8 percent, or 0.018. First, obtain the standard error of the estimate by multiplying the receipts estimate by its RSE. For this example, multiply $10,750 million by 0.018. This yields a standard error of $193.5 million. The upper and lower bounds of the 90-percent confidence interval are computed as $10,750 million plus or minus 1.645 times $193.5 million or $318.3 million. Consequently, the 90-percent confidence interval for this receipts estimate is $10,432 million to $11,068 million. If corresponding confidence intervals were constructed for all possible samples of the same size and design, approximately 9 out of 10 (90 percent) of these intervals would contain the result obtained from a complete enumeration.
Non-Sampling Error
Non-sampling error encompasses all other factors that contribute to the total error of a sample survey estimate and may also occur in censuses. It is often helpful to think of non-sampling error as arising from deficiencies or mistakes in the survey process. In the ESP, non-sampling error can be attributed to many sources:
- Inability to identify all cases in the actual universe,
- Definition and classification difficulties,
- Differences in the interpretation of questions,
- Errors in recording or coding the data obtained, and
- Other errors of collection, response, coverage, processing and estimation for missing or misreported data.
Although no direct measurement of the potential biases due to non-sampling error has been obtained, precautionary steps were taken in all phases of the collection, processing, and tabulation of the data in an effort to minimize their influence. The Census Bureau recommends that individuals using estimates in this report incorporate this information into their analyses, as non-sampling error could affect the conclusions drawn from these estimates.
Nonresponse
A potential source of bias in the estimates is nonresponse. Nonresponse is defined as the inability to obtain all the intended measurements or responses from all units in the sample. This may result when:
- A particular question (in a returned questionnaire) is left unanswered or the reported response to the question fails computer or analyst edits, or
- The entire questionnaire is not returned (complete nonresponse).
The method for handling non-response depends on the particular data item that was not reported (or reported incorrectly). These data items are:
- Receipts
- All other data items (such as revenue from royalties and license fees, research and development expenses, etc.)
Nonresponse to the receipts questions is corrected by imputation, which is the procedure by which a missing value (or response that failed edits) is replaced by a comparable value obtained from analyst research or from the Statistics of U.S. Businesses (which may have obtained its receipts data from the 2012 Economic Census). In some cases, analysts are able to obtain enterprise receipts data from published sources such as company annual reports. If these are not available then the establishment receipts data collected by the 2012 Economic Census are consolidated to the enterprise level in the Statistics of U.S. Businesses and substituted for the missing or unacceptable receipts value. Note that Statistics of U.S. Businesses sums the receipts of the establishments that make up the company. This may result in some duplication of receipts for large multi-establishment enterprises as the establishment data includes the value of transfers within an enterprise. For example, if a manufacturing establishment ships products to a wholesale establishment in the same company, the manufacturing establishment will report the value of these shipments to the Economic Census. When the wholesale establishment sells these products, it will report the value of the sales. Simply summing the value of the shipments of the manufacturing establishment and the sales of wholesaling establishment will be counting the value of the same product twice. At the enterprise level, it is only the sale to a final customer that counts as enterprise receipts.
For all other variables on the ESP questionnaire, no attempt was made to impute a value. For these data items, the number of enterprises that failed to respond to the question and their associated total receipts are reported in the appropriate tables.
Response Rates - Receipts
The ESP produces two different response rates: a unit response rate and a total quantity (or item) response rate for receipts. These are shown in table 4 at the total and sector levels.
Table 4: 2012 ESP Response Rates
Sector |
Title |
URR |
TQRR-Receipts |
00 |
All sectors |
76.1% |
70.2% |
21 |
Mining, Quarrying, and Oil & Gas Extracting |
69.8% |
75.5% |
22 |
Utilities |
86.2% |
77.4% |
23 |
Construction |
81.6% |
79.6% |
31-33 |
Manufacturing |
83.7% |
64.8% |
42 |
Wholesale Trade |
80.5% |
77.0% |
44-45 |
Retail Trade |
73.7% |
67.4% |
48-49 |
Transportation & Warehousing |
79.8% |
76.1% |
51 |
Information |
77.1% |
71.0% |
52 |
Finance & Insurance |
69.7% |
67.4% |
53 |
Real Estate and Rental & Leasing |
67.7% |
69.3% |
54 |
Professional, Scientific, & Technical Services |
81.4% |
76.4% |
56 |
Administrative and Support & Waste Management and Remediation Services |
81.8% |
66.1% |
61 |
Educational Services (except 6111, 6112, & 6113) |
77.1% |
85.8% |
62 |
Health Care and Social Assistance |
72.3% |
66.4% |
71 |
Arts, Entertainment, & Recreation |
80.3% |
80.4% |
72 |
Accommodation & Food Services |
63.8% |
67.5% |
81 |
Other Services (except Public Administration) |
74.6% |
84.8% |
Unit Response Rate (URR) - The Unit Response Rate is defined as the ratio (expressed as a percentage) of the total unweighted number of enterprises that responded to the total number of enterprises that were eligible (or potentially eligible) for data collection. For an enterprise to be classified as a response, its receipts must have been reported or be considered equivalent-quality-to-reported. URRs are indicators of the performance of the data collection process in obtaining usable responses.
Total Quantity Response Rate (TQRR-Receipts) - The Total Quantity Response Rate is defined as the percentage of the estimated (weighted) total receipts that is based on reported data or from sources determined to be of equivalent-quality-to-reported data. The TQRR is an item-level indicator of the “quality” of each estimate. In contrast to the URR, these weighted response rates are computed for individual data items. In the case of the ESP, this is receipts.
Response Rates – Payroll and Employment
The payroll and employment estimates produced by the ESP were calculated by consolidating (to the enterprise level) the payroll and employment data collected at the establishment level by the 2012 County Business Patterns (CBP). These data were not separately collected on the ESP questionnaire. Therefore, no response rates for these data items are provided by ESP.
Response Rates – Other Data Items
For non-receipts data items collected on the ESP questionnaire (such as revenue from royalty and license fees, research and development expenses, manufacturing activity, etc.) no attempt was made to impute for any missing data as there was no clear method for doing this and is consistent with the treatment of these data items in the 2011 ESP. Instead, the estimated number of non-responding enterprises and their receipts are shown in the appropriate table. These estimates are shown in rows labeled, “(data item) not reported”.
Disclosure Avoidance
Disclosure is the release of data that have been deemed confidential. It generally reveals information about a specific individual or enterprise or permits deduction of sensitive information about a particular individual or enterprise. Disclosure avoidance is the process used to protect the confidentiality of the survey data provided by an individual or enterprise.
Using disclosure avoidance procedures, the Census Bureau modifies or removes the characteristics that put confidential information at risk of disclosure. Although it may appear that a table shows information about a specific individual or business, the Census Bureau has taken steps to disguise or suppress the original data while making sure the results are still useful. The techniques used by the Census Bureau to protect confidentiality in tabulations vary, depending on the type of data.
Noise Infusion
The Enterprise Statistics Program adopted the Noise Infusion method of data protection. Noise infusion is a method of disclosure avoidance in which values for each enterprise are perturbed prior to table creation by applying a random noise multiplier to the magnitude data (i.e., characteristics such as receipts, payroll, number of employees, etc.) for each enterprise. Disclosure protection is accomplished in a manner that results in a relatively small change in the vast majority of cell values.
For the Enterprise Statistics Program, each published cell value has an associated noise flag, indicating the relative amount of distortion in the cell value resulting from the perturbation of the data for the contributors to the cell. These flags are:
G – (low noise) indicates the cell estimate was changed by less than 2 percent with the application of noise.
H - (moderate noise) indicates the cell estimate was changed by 2 percent or more but less than 5 percent.
J – (high noise) indicates the cell estimate was changed by 5 percent or more.
Suppressed Estimates
Estimates are suppressed when the quality of the estimate does not meet publication standards. These include:
- The relative standard error (RSE) of the estimate is greater than 30%,
- There are fewer than three enterprises contributing to the estimate,
- To provide additional disclosure avoidance protection, or
- Because of other concerns about an estimate’s quality.
There are several situations in which a numeric estimate or a noise flag is replaced with a character symbol. These situations are shown in Table 5.
Table 5: ESP Table Symbols
Symbol |
Meaning |
N |
Not available. This symbol is used in Table 6 to represent the (unknown) royalties and licensing fee revenue of enterprises that did not respond to this question. |
S |
Suppressed. The estimate was withheld because it did not meet publication standards (as discussed above). |
X |
Not applicable. This symbol is used in rows for which we have no data but have been inserted in the tables to avoid leaving gaps in a set of ranges (1 – 25, 51 – 100, etc.). It is also used in Table 6 for certain estimates of enterprises that reported that they did not have any royalty or license fee revenue. |
Z |
Rounds to zero. This symbol represents estimates that are actually greater than zero but that round to zero at the level that the numeric data are published. For the ESP, this means an estimate of less than $500,000. |
The number of enterprises in a particular tabulation cell is not considered a disclosure of confidential information; therefore, this information may be released without the infusion of noise. For an introduction to the noise confidentiality protection method, see Using Noise for Disclosure Limitation of Establishment Tabular Data by Timothy Evans, Laura Zayatz, and John Slanta in the Journal of Official Statistics (1998).
Unpublished Estimates
Estimates may be suppressed because of high sampling variability, poor response quality, or other concerns about the estimate’s quality. Some of these suppressed estimates can be derived indirectly from the ESP tables by subtracting published estimates from their respective totals. However, the (unpublished) estimates obtained by such subtraction would be subject to poor response, high sampling variability, or other factors that may make them potentially misleading. Estimates derived in this manner should not be attributed to the Census Bureau. Individuals who use estimates in these tables to create new estimates should cite the Census Bureau as the source of only the original estimates.
Data Product Comparability
Comparability with Prior ESP Publications
The 2011 and 2007 ESP publications were prototypes and were produced for evaluation and comment by data users. Data users should exercise great care when comparing these data with the 2012 published data. There are several reasons for this:
- The 2007 and 2011 publications used the 2007 NAICS vintage. The 2012 publications use the 2012 NAICS vintage. See the NAICS Comparability section for a discussion of the NAICS changes between 2007 and 2012.
- The 2007 and 2011 publications used the Enterprise Classification System for classifying enterprises to an industry. See the description of the Enterprise Classification System (ECS) Categories and Corresponding Establishment NAICS Industries for further information. The 2012 ESP uses the standard (2012) NAICS codes. The most detailed level of industry classification assigned to an enterprise in 2012 is the 4-digit NAICS.
- Enterprises present in more than one survey year were not necessarily classified in the same industry from one survey year to the next.
- The 2007 and 2011 ESP samples were non-probability samples and were not designed to represent the entire universe of in-scope enterprises. The 2012 ESP sample is a probability sample and the estimates produced from it do reflect the entire in-scope universe.
- The 2011 ESP sample consisted of 24,055 large (employment > 250) multi-establishment enterprises only. The 2012 ESP sample of 261,106 contained both single and multi-establishment enterprises.
- The 2012 ESP was able to make use of some 2012 Economic Census data for both imputation and evaluation purposes.
Table 6: Comparability of 2011 and 2012 ESP Publications
Topic |
2011 |
2012 |
Issues |
Classification Scheme |
Enterprise Classification System (ECS) |
NAICS (2012 vintage) |
Comparable at the sector level. |
Enterprise classification |
Based on 2011 administrative payroll |
Based on 2012 administrative payroll |
Enterprises included in both years were not necessarily classified into the same industry from one year to the next. |
Sample size |
24,055 enterprises |
261,106 enterprises |
|
Sample design |
(1) Non-probability, (2) Contains only large, multi-establisment enterprises (at least 250 employees) (3) Not representative |
(1) Probability sample, stratified by industry (2) Includes both multi and single establishment enterprises (3) Representative |
Not comparable |
Data sources |
(1) Company Organization Survey questionnaire (2) Administrative data |
(1) Company Organization Survey questionnaire (2) Administrative data (3) 2012 Economic Census |
In both years, most data comes from the COS questionnaire. |
Estimates |
(1) Simple sum of the data from the 24,055 enterprises (2) Total revenue: $19.6 trillion |
(1) Weighted sum of the sample enterprises (2) Total weighted revenue: $30.0 trillion |
Not comparable |
Royalty & License Fee Detail |
Five categories |
Four categories ("Business format franchise fees" is combined with "Other") |
|
Comparability with the 2012 Economic Census
The 2012 ESP estimates are not directly comparable to the 2012 Economic Census estimates for several reasons. These are:
- The receipts, payroll, and employment of an enterprise in the ESP are all tabulated in a single NAICS industry. In the Census, every individual establishment in a company is tabulated in its own industry. If Census data were used to classify an enterprise into an industry, it is possible that this classification would be different from the ESP industry classification (which is based on administrative data).
- Receipts and other data, reported in the ESP at the enterprise level, may not exactly equal the sum of the receipts and other data of the individual Census establishments.
- Approximately 280,000 single-establishment enterprises that started business late in 2012 did not have had the opportunity to be included in the ESP sample though they were included in the Census.
- Generally all multi-establishment enterprises are included in the ESP. However, during the processing of the Economic Census some single-establishment enterprises were converted to multi-establishment enterprises based on their response to the Census questionnaire. In 2012, this process created approximately 31,000 multi-establishment Census enterprises. Few of these were in the ESP sample.
NAICS Comparability
The data for most sectors as defined under the 2012 NAICS are completely comparable to 2007 NAICS. However, listed in Table 7 are the sectors that were affected by the 2012 NAICS revision (along with a summary of the changes):
Table 7: Selected NAICS Changes Between 2007 and 2012
Sector |
NAICS Change |
22 (Utilities) |
2007 NAICS code 221119 (Other Electric Power Generation) was split into five 2012 NAICS codes:
|
23 (Construction) |
Selected activities from:
|
31-33 (Manufacturing) |
Over 100 individual 2007 NAICS codes were consolidated into new 2012 NAICS groupings. For a full list of these changes, see the 2012 NAICS Manual referenced above. |
42 (Wholesale) |
|
44-45 (Retail Trade) |
Ten individual 2007 NAICS codes were impacted by the 2012 NAICS revision, including
For a full list of these changes, see the 2012 NAICS Manual referenced above. |
72 (Accommodation & Food Services) |
Four 2007 NAICS codes were assigned new 2012 NAICS codes under the same 4-digit NAICS industry group, with no change in the content of the industry. These are:
|
Revisions and changes to the NAICS classification system occur every 5 years. View the latest version of the U.S. North American Industry Classification System. The official 2012 U.S. NAICS Manual is available in print and on CD-ROM from the National Technical Information Service (NTIS) at (800) 553-6847 or (703) 605-6000, or through the NTIS Web site.
