
Children’s Public Health Insurance Coverage Lower Than in 2017
About 4.3 million children did not have any health insurance coverage in 2018, an increase of 425,000 (or 0.6 percentage points) from the previous year, according to the U.S. Census Bureau’s annual Health Insurance Coverage in the United States: 2018 report released today.
The new report highlights that 5.5% of children under the age of 19 were uninsured, largely because of a decline in public coverage.
Children obtain health insurance coverage from a number of different sources. Many have coverage through a parent’s private plan, and many lower income children may qualify for certain public programs, such as Medicaid or the Children’s Health Insurance Program (CHIP).
The new report highlights that 5.5% of children under the age of 19 were uninsured, largely because of a decline in public coverage.
Taking a closer look at children’s coverage highlights some key changes in coverage between 2017 and 2018 by coverage type and by age, region and income-to-poverty status.
Decrease in Medicaid and CHIP Coverage
While the percentage of children with private health insurance coverage did not statistically change, the percentage with public coverage fell by 1.3 percentage points.
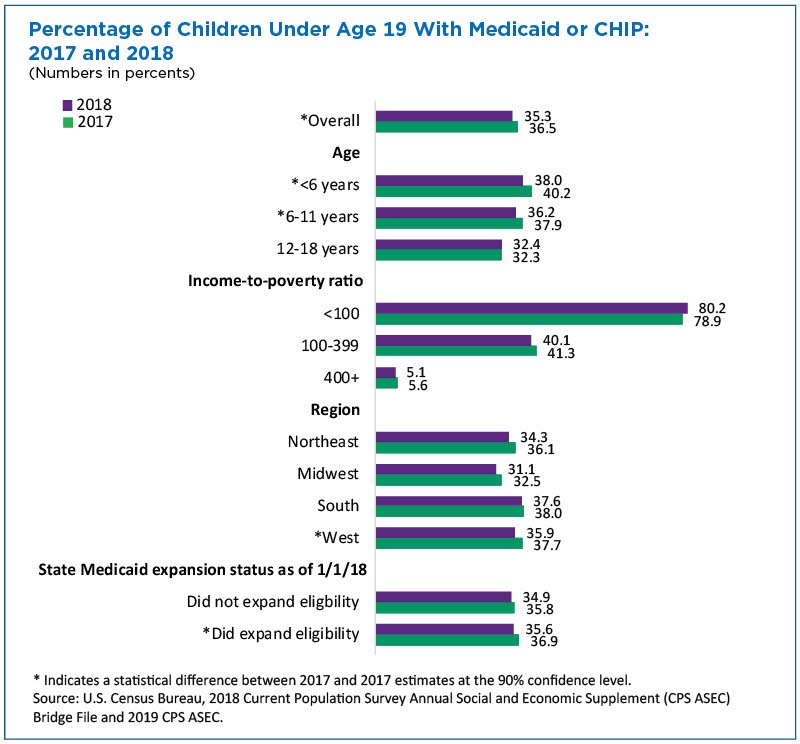
Most of this decrease was because children’s Medicaid and CHIP coverage rates declined. In 2018, 35.3% of children had Medicaid or CHIP, compared with 36.5% in 2017.
Both of these programs target low-income children.
Medicaid is a public program that provides health insurance coverage for children (and adults) with incomes below a certain level. CHIP is a public program that provides health insurance for children in families with income too high to qualify for Medicaid but who are likely unable to afford private health insurance.
Medicaid and CHIP are separate programs, but we cannot disentangle these types of coverage from each other or from other types of medical assistance programs reported in the Current Population Survey Annual Social and Economic Supplement.
Which Children Experienced Change?
Rates of insurance coverage overall, and Medicaid and CHIP coverage in particular, did not fall equally for all children.
The figures below show the change in coverage between 2017 and 2018 for overall coverage and for Medicaid and CHIP for various groups.
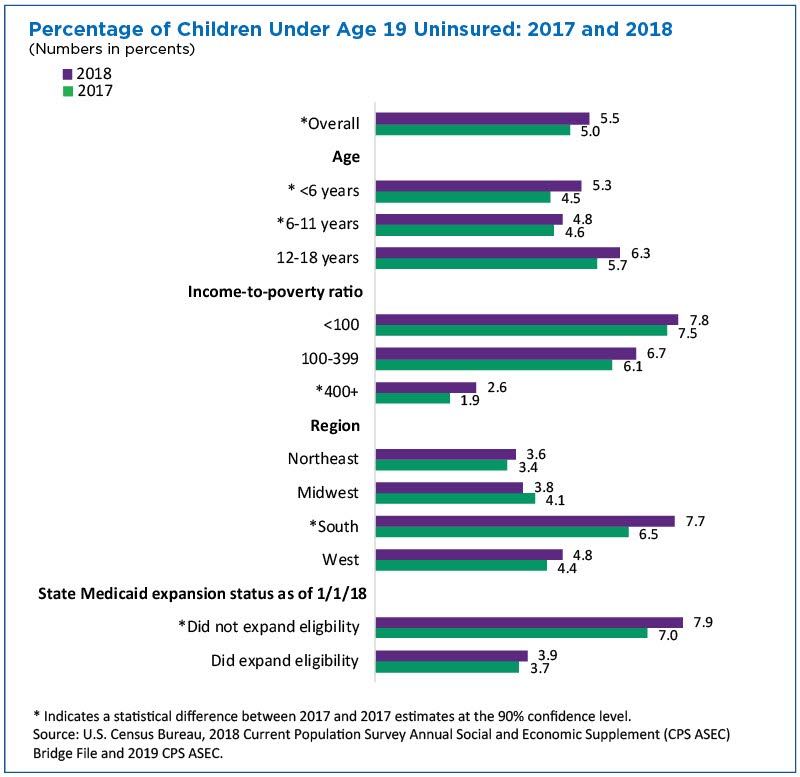
For example, Medicaid and CHIP coverage fell for the youngest children (under 6 years old) and for 6-to-11 year-olds, but did not statistically change among 12-to-18 year-olds.
The uninsured rate also rose for children under 6 years old and for 12-to-18 year-olds.
Variation by Income
The change in the Medicaid and CHIP rate also varied by household income-to-poverty ratio.
As noted earlier, Medicaid and CHIP both target low-income children. Although none of the groups experienced a statistical change, there were differences from one income-to-poverty group to another.
Geographic Variations
There were regional differences in changes in Medicaid and CHIP coverage among children. Medicaid coverage among children decreased in the West but did not statistically change in any other region.
Another way to think about geography is to consider whether a child lives in one of the 31 states (or in the District of Columbia) that expanded Medicaid eligibility as part of the Affordable Care Act (ACA).
The percentage of children with Medicaid or CHIP coverage decreased in states that expanded Medicaid eligibility (expansion states) but did not statistically change in states that did not expand Medicaid eligibility (nonexpansion states).
This was the opposite of what happened for coverage overall. The percentage of children without any health insurance increased in nonexpansion states, but did not statistically change in expansion states.
The CPS ASEC microdata, also released today, allow data users to take a closer look at other types of coverage and other age groups.
Also Released Today
Subscribe
Our email newsletter is sent out on the day we publish a story. Get an alert directly in your inbox to read, share and blog about our newest stories.
Contact our Public Information Office for media inquiries or interviews.
-
Income and Poverty2018 U.S. Median Household Income Was $63,179, No Big Change From 2017September 10, 2019U.S. Census Bureau released 2018 income, poverty and health insurance statistics today. Survey redesigns make comparing statistics from prior years challenging.
-
Income and PovertyPayday, Poverty, and WomenSeptember 10, 2019Between 2017 and 2018, women working full-time, year-round experienced a significant gain in median earnings but more women than men live in poverty.
-
Income and PovertyPoverty Rate for People in Woman-Led Households Lowest on RecordSeptember 10, 2019The U.S. poverty rate dropped from 12.3% in 2017 to 11.8% in 2018. The decrease in poverty for women-led families comprised much of...
-
PopulationU.S. Fertility Continues to Drop but Still High in Some CountiesJune 25, 2026Counties with the highest numbers of births have some of the lowest fertility rates.
-
TaxationFundamental Shifts in State Taxes in Past CenturyJune 17, 2026Income and sales taxes have largely replaced property taxes, once the lion’s share of state tax revenue.
-
HousingHelping You Decide Where to Buy a HomeJune 10, 2026Census Bureau resources help homebuyers find the best locations for their needs.
-
Population2026 World Cup Teams Will Have Home Crowds Among U.S. Foreign-BornJune 09, 2026Census data show which of the 48 countries in the World Cup have the largest foreign-born fan bases in the United States and where they live.