
Survey Redesigns Make Comparisons to Years Before 2017 Difficult
The U.S. median household income was $63,179 in 2018, not statistically different than the previous year, according to U.S. Census Bureau statistics released today.
At first glance, it would appear that median income was higher than every year prior to 2017, surpassing the median income for 2007 ($60,985 in 2018 dollars) and 1999 ($61,526 in 2018 dollars).
In 2017, the median income was $62,626, not statistically different from 2018. So, making comparisons prior to 2017 requires caution, since recent estimates reflect changes implemented to the survey.
The 2018 income, poverty and health insurance statistics released today come from the Current Population Survey Annual Social and Economic Supplement, known as CPS ASEC.
In 2017, the median income was $62,626, not statistically different from 2018. So, making comparisons prior to 2017 requires caution, since recent estimates reflect changes implemented to the survey.
Income questions were redesigned in the 2014 CPS ASEC for data year 2013 and the processing system was updated in the 2019 CPS ASEC for data year 2018.
As a result, some of the differences over time could be due to these recent survey improvements.
Changing Questions
To understand differences in estimates due to the questionnaire change, the 2014 CPS ASEC used a split panel design which asked both traditional and redesigned income questions (see Appendix D of the 2014 Income and Poverty report for estimates).
Likewise, to understand the impact of the new processing system in the 2019 CPS ASEC, the Census Bureau re-released data from 2017, with one set of estimates reflecting the legacy processing system and one set based on the updated processing system (as discussed in working papers on income and poverty estimates).
These survey changes affected estimates of median household income and income and poverty estimates for some subgroups.
For each change, the percentage difference in median household income is shown below. The new questionnaire led to a 3.17% increase in median income, while the impact of the new processing system was not statistically significant.

What Happens When Changes Are Not Taken Into Account
Without adjusting for these changes, 2018 has higher median household income than each year prior to 2017.
One way to make pre-improvement estimates comparable to current data could be to adjust them up or down by the percentage difference of each improvement:
- For income in 2017 and 2018, the data don’t need adjusting as estimates are available with the redesigned questionnaire and the updated processing system.
- For income in 2013 to 2016, the estimates are adjusted by the percentage difference in the 2018 processing update, -0.38%.
- For income in 2012 and before, the estimates would be adjusted for both data improvements, and the magnitude of the adjustment would be equal to 2.77%.
The 2.77% adjustment comes from using the 3.17% and -0.38% differences shown above: (1 + 0.0317)*(1 – 0.0038) = (1+0.0277).
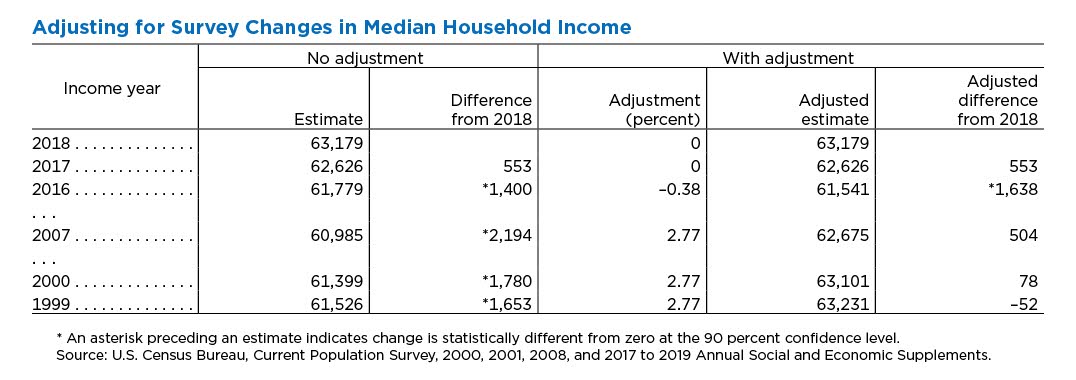
Without the adjustment, income in 2018 is significantly higher than all years shown prior to 2017. However, with the adjustment, it is higher than all the pre-2017 years except 2007, 2000 and 1999.

How Changes Affect Poverty Measures
Because income is used to determine poverty status, changes to income can also affect poverty statistics.
While overall poverty rates were not statistically changed by either of these survey improvements, the changes did affect poverty estimates for some demographic groups.
The same method can be applied to compare poverty statistics for subgroups whose poverty estimates were affected by the redesign.
For the poverty rate among individuals in families headed by a female with no spouse present in 2013 to 2016, estimates are adjusted by 0.6 percentage points.
For the same group in 2012 and prior, the adjustment would be 1.8 percentage points.
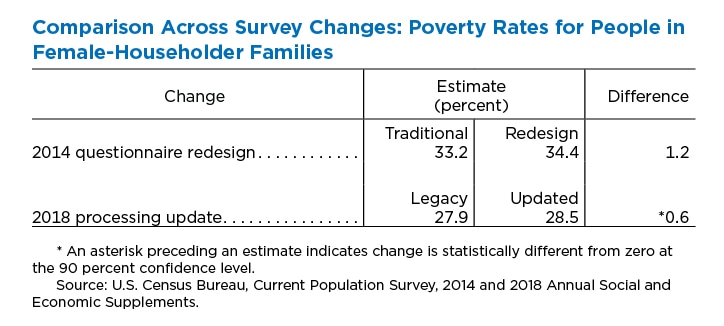
These adjusted estimates show that poverty was lower for this group in 2018 than in all other available years.

These adjustments are not made in our official publications and table packages because it requires the assumption that the impact of the survey changes would have been identical in all years, an assumption that is less likely to be accurate in years further away from these methodology changes.
While the CPS ASEC provides income statistics, another source of income data is the American Community Survey, which provides consistent statistics back to 2005.
Also Released Today
Subscribe
Our email newsletter is sent out on the day we publish a story. Get an alert directly in your inbox to read, share and blog about our newest stories.
Contact our Public Information Office for media inquiries or interviews.
-
HealthUninsured Rate for Children Up to 5.5 Percent in 2018September 10, 2019Overall, the uninsured rate for children rose in 2018, driven by a decline in the percentage of children with public coverage, such as Medicaid.
-
Income and PovertyPoverty Rate for People in Woman-Led Households Lowest on RecordSeptember 10, 2019The U.S. poverty rate dropped from 12.3% in 2017 to 11.8% in 2018. The decrease in poverty for women-led families comprised much of...
-
Income and PovertySupplemental Poverty Measure Shows State-Level Impact of Food StampsSeptember 10, 2019Report released today shows that the Supplemental Nutrition Assistance Program reduced poverty by just over 1 percentage point on average from 2016 to 2018.
-
PopulationMeasuring Foreign-Born Population Over Nation’s 250-Year HistoryJuly 21, 2026Historical census data document changes in the foreign-born population in both numbers and countries of origin.
-
Business and EconomyA Road Trip Across the Vacation EconomyJuly 14, 2026The Census Bureau rings in the summer with a travel statistics road map.
-
HealthWhere You Live Matters for Your Health and So Does How We Measure ItJuly 09, 2026Census Bureau research helps policymakers and researchers identify the most reliable ways to predict health outcomes and distribute resources accordingly.
-
PopulationU.S. Fertility Continues to Drop but Still High in Some CountiesJune 25, 2026Counties with the highest numbers of births have some of the lowest fertility rates.