Majority of Voters Used Nontraditional Methods to Cast Ballots in 2020
The COVID-19 pandemic led to a variety of changes in voting methods across the country in 2020, and the ways people could cast ballots varied widely from state to state.
Many states maintained traditional voting procedures, but some expanded early voting, and others automatically sent all registered voters a ballot that could be returned by mail.
In the 2020 election, 69% of voters nationwide cast their ballot nontraditionally — by mail and/or before Election Day.
New data from the Current Population Survey's November 2020 Voting and Registration Supplement released today show us in detail the ways voters cast their ballot at the national and state levels and allow us to compare voting methods and voter turnout across elections. Since these estimates are derived from survey responses, they differ from official reports from each state and estimates from other data sources.
In the 2020 election, 69% of voters nationwide cast their ballot nontraditionally — by mail and/or before Election Day. This is the highest rate of nontraditional voting for a presidential election (Figure 1) since questions regarding voting method have been included in the survey.
By comparison, about 40% of voters cast their ballots by mail and/or prior to Election Day in 2016.
Much of the surge in nontraditional voting was due to an increase in mail-in voting.
In 2020, 43% of voters cast ballots by mail and another 26% voted in person before Election Day. In 2016, 21% mailed in their ballots and 19% voted in person prior to Election Day.

Who Voted Using Nontraditional Methods?
The degree to which voters used nontraditional methods in the 2020 election varied across demographic groups by age, education, sex and race/ethnicity (Figure 2).
- A larger share of voters age 65 and over voted nontraditionally (77.7%) than those in younger age groups (69.7% or less).
- Those with a bachelor’s degree or higher also voted early or by mail at a higher rate (74.5%) than those with lower educational attainment (63.2% for high school graduates).
- Women (71.2%) used nontraditional voting methods at a higher rate than men (67.4%).
- Of the racial groups, the highest share of nontraditional voting was among Asian alone, non-Hispanic voters (82.4%).

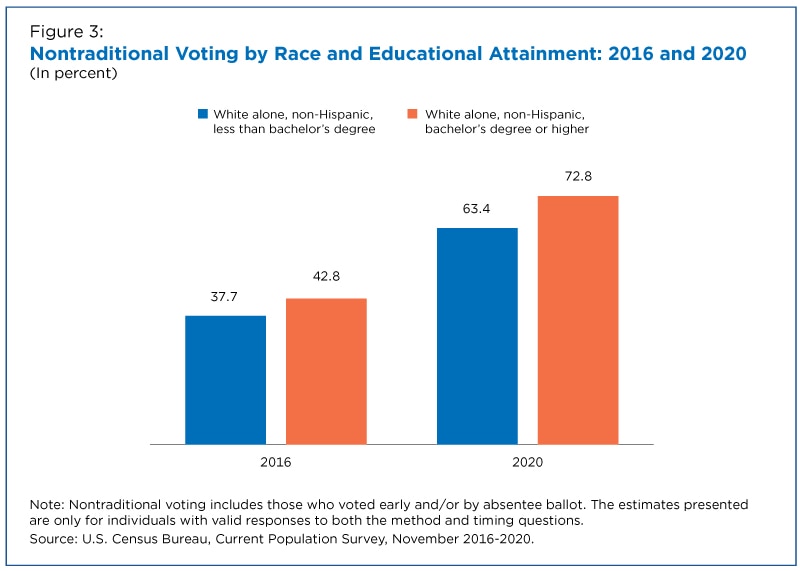
Educational attainment appears to have played a greater role in White alone, non-Hispanic voters’ decision to cast their ballot in a nontraditional way in 2020 than in 2016 (Figure 3), an outcome not evident for other race and Hispanic origin groupings.
Among race and Hispanic groups, the growth in the gap in the use of nontraditional voting based on education was statistically significant only among the White alone, non-Hispanic population.
In 2016, among the White alone, non-Hispanic population, there was a 5.1 percentage-point gap in the use of nontraditional voting between those with less than a bachelor's degree (37.7%) and those with a bachelor's degree or more (42.8%). That gap grew to 9.4 percentage points in 2020: 63.4% of those with less than a bachelor's degree voted nontraditionally, compared with 72.8% of those with a bachelor's degree or higher.
How Voting Methods Varied by State
Use of nontraditional voting also varied across states. Map 1 displays nontraditional voting rates in the 2020 election at the state level.
In states such as Washington and Oregon, which have sent all registered voters a mail-in ballot for multiple electoral cycles, over 95% of voters cast their ballot by a nontraditional method.
Other states continued to rely on traditional voting methods. For example, only 15.1% of voters in Alabama and 18.5% in Mississippi cast ballots nontraditionally (the two percentages did not differ statistically).
Map 2 displays the change in estimated nontraditional voting rates by state from 2016 to 2020, reflecting the varying degree to which states adapted their voting procedures prior to the 2020 election.
Some states that relied heavily on nontraditional voting in 2016 continued to do so in 2020. For example, the nontraditional voting rate in Colorado was 90.4% in 2016, compared with 97.2% in 2020.
Other states that did not use nontraditional voting methods extensively in 2016 continued to make limited use of those methods in 2020. For example, in Oklahoma, 17.0% of voters cast ballots early or by mail in 2016, compared with 23.2% in 2020.
A third group of states saw large shifts in their use of nontraditional voting between 2016 and 2020. In New Jersey, for example, 7.9% of voters cast ballots early or by mail in 2016, compared with 92.3% in 2020, when all registered New Jersey voters received a ballot in the mail.


Record Turnout
In addition to changes in method of voting, the 2020 election saw among the highest levels of turnout recorded in recent elections. Is the use of nontraditional voting methods associated with the change in voter turnout?
As shown in Figure 4, people living in the quartile of states that used nontraditional voting methods at the highest rate in 2020 also saw a larger change in turnout between the 2016 and 2020 elections than that of people living in the remaining states.
Among those living in states that used nontraditional voting methods at the highest rate in 2020, turnout increased by 7.7 percentage points compared with the 2016 election. For example, in Hawaii, 97.6% of voters cast ballots early or by mail in 2020 and turnout increased by an estimated 17.0 percentage points.

The 2020 election will long be remembered for having taken place during a pandemic. As the above findings indicate, the methods of voting used by those casting a ballot were significantly different from prior elections, though the magnitude and nature of the changes varied from state to state.
Note: Additional information on confidentiality protection, sampling error, nonsampling error and definitions is available.
Zachary Scherer is a statistician in the Census Bureau’s Social, Economic, and Housing Statistics Division.
Story Ideas and Statistics
-
VisualizationHistorical Apportionment Data Map (Interactive)This interactive tool enables users to view more than 10 decades of apportionment and population data.
-
Stats for StoriesPresidents’ Day: February 19, 2024Observed the third Monday of February, the day honors all former U.S. presidents. President Washington was born Feb. 22, 1732. Lincoln was born Feb. 12, 1809.
Subscribe
Our email newsletter is sent out on the day we publish a story. Get an alert directly in your inbox to read, share and blog about our newest stories.
Contact our Public Information Office for media inquiries or interviews.
-
America Counts StoryRecord High Turnout in 2020 General ElectionApril 29, 2021Despite concerns that voter turnout would be lower during the pandemic, the 2020 election had the century’s highest turnout.
-
America Counts StoryWhat Recent Elections Tell Us About the American Voter TodayOctober 05, 2020In the last presidential election, 70% of the voting-eligible population registered to vote and 61% voted. Almost 9 in 10 registered voters cast a ballot.
-
America Counts StoryBehind the 2018 U.S. Midterm Election TurnoutApril 23, 2019New Census Bureau data show that voting increased among all voting age and major racial and ethnic groups.
-
Business and EconomyA Road Trip Across the Vacation EconomyJuly 14, 2026The Census Bureau rings in the summer with a travel statistics road map.
-
HealthWhere You Live Matters for Your Health and So Does How We Measure ItJuly 09, 2026Census Bureau research helps policymakers and researchers identify the most reliable ways to predict health outcomes and distribute resources accordingly.
-
PopulationU.S. Fertility Continues to Drop but Still High in Some CountiesJune 25, 2026Counties with the highest numbers of births have some of the lowest fertility rates.
-
TaxationFundamental Shifts in State Taxes in Past CenturyJune 17, 2026Income and sales taxes have largely replaced property taxes, once the lion’s share of state tax revenue.