Heightened Focus on Early Childhood Education Programs as Preschool Enrollment Increased Before COVID-19
State funding of preschool programs surpassed $9 billion in the District of Columbia and the 44 states that funded preschools in the 2019-20 school year and policymakers are increasingly focusing on early childhood education, including the current administration’s proposed initiative of universal pre-school for 3- and 4-year-olds.
These initiatives may facilitate more preschool enrollment, which research links to improved academic and behavioral outcomes for children later in life.
So, how has U.S. enrollment in preschool programs changed in recent years?
Along with the overall growth in enrollment, 2005 to 2019 saw a major shift in the type of preschools parents chose: Public schools became much more prominent.
U.S. Census Bureau analysis of data from the American Community Survey (ACS) from 2005 to 2019 shows the percentage of children ages 3 and 4 enrolled in preschool overall went up during that period.
This period of analysis ended before the COVID-19 pandemic hit the U.S. so does not reflect its impact on preschool enrollment.
The proportion of 3- and 4-year-olds enrolled in preschool increased from 2005 to 2008 by 3.4 percentage points to 47.4% (Figure 1) but after that declined until 2013.
While other factors may have been at play, the global recession most likely contributed to this downward trend as many parents were out of work and may have been unable to afford preschool.
However, as noted, preschool enrollment started to inch up again in 2013 and has resumed its upward trend.
Changes in Types of Preschools
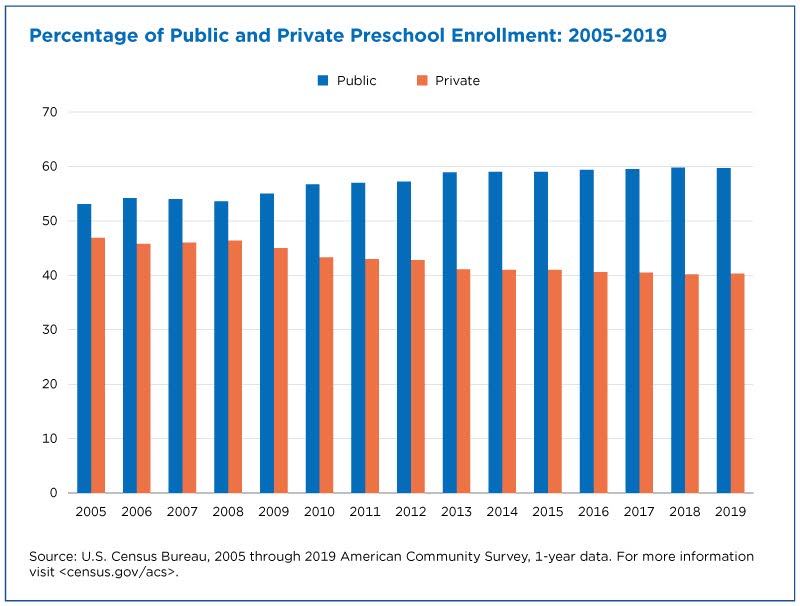
Along with the overall growth in enrollment, 2005 to 2019 saw a major shift in the type of preschools parents chose: Public schools became much more prominent.
From 2005-2019, the percentage of preschool enrollees attending public school increased by 6.6 percentage points, to 59.7% (Figure 2).
Differences by State
In 2019, preschool enrollment was highest in the Northeast, with most states in the region enrolling 54% or more of their 3- and 4-year-olds.
However, other states, including Illinois and Mississippi, also had high levels of preschool enrollment. And more than 80% of 3- and 4-year-olds in the District of Columbia, which implemented an expansive universal preschool program in 2008, were enrolled in preschool in 2019.
Although the geographic pattern of growth in preschool enrollment was not confined to a certain region or state, the Northeast and West can be characterized as high-growth areas.
New England states started with a high level of preschool enrollment in 2005 but other places, such as Nevada and Washington, expanded their preschool enrollment from relatively low initial levels.
The ACS data show that preschool enrollment changed across the United States from 2005 to 2019 and a larger share of children were enrolled in preschool by the end of the study period.
Federal and state governments can use this ACS data to explore changes in preschool enrollment as they consider early education policies.
The Census Bureau is studying geographic and demographic factors that may help explain why some children are enrolled in preschool and others are not.
Enrollment during the Pandemic
Recently released 2020 data from another survey, the Current Population Survey (CPS), showed declines in preschool enrollment during the COVID-19 pandemic.
According to CPS data, the percentage of kids ages 3 and 4 enrolled in school fell from 54% in 2019 to 40% in 2020, the first time since 1996 that fewer than half of the children in this age group were enrolled. Nursery school enrollment fell by 25% (from 4.7 million to 3.5 million).
Future data releases will tell us if preschool enrollment rebounds after the pandemic.
See the 2020 CPS school enrollment tables for more information on enrollment during the pandemic in 2020.
Kevin Mcelrath is a survey statistician in the Census Bureau’s Social, Economic and Housing Statistics Division.
Subscribe
Our email newsletter is sent out on the day we publish a story. Get an alert directly in your inbox to read, share and blog about our newest stories.
Contact our Public Information Office for media inquiries or interviews.
-
America Counts StoryU.S. Spending on Public Schools in 2019 Highest Since 2008May 18, 2021New Annual Survey of School System Finances data show the nation spent $752.3 billion on its 48 million children in public schools in 2019.
-
America Counts StoryElementary, Secondary School Revenue, Spending Increased in Most AreasOctober 05, 2021Preliminary data show most categories of elementary and secondary school system spending increased from FY2019 to FY2020, with some exceptions due to COVID-19.
-
America Counts StoryBlack High School Attainment Nearly on Par With National AverageJune 10, 2020In recent years, Black educational attainment has been much closer to the national average: 88% have a high school diploma. Gaps remain in college attainment.
-
PopulationU.S. Population Growth Slowest Since COVID-19 PandemicJanuary 27, 2026The decline in international migration was felt across the states, though its impact varied.
-
Business and EconomyWho Are the Inventors and Firms That Generate the Most Patents?January 22, 2026Research that links patent inventors to Census Bureau data shows that startups tended to produce fewer but more impactful patents than older firms.
-
Marriage and DivorceThe Long-Term Effects of Divorce on ChildrenJanuary 20, 2026Children of divorce face higher risks of teen pregnancy, incarceration, low income and early death.
-
Business and EconomyExploring New Frontiers With the Quarterly Workforce IndicatorsJanuary 13, 2026New data on employment and hiring for detailed national industries enable data users to explore the composition and dynamics of specialized workforces.


