New U.S. Census Bureau Data Show Detailed Characteristics of Home-Based Workers
The share of the workforce working from home has declined in recent years but remains more than double what it was before COVID-19. New data reveal significant inequalities between remote workers and commuters: remote workers tend to be older, are more likely to be White and less likely to be in poverty.
Because of the increased prominence of home-based workers within the U.S. workforce, American Community Survey (ACS) tables have been updated beginning in 2023 to include their key sociodemographic characteristics.
These findings are consistent with earlier research that showed the generally higher earnings of home-based workers and the disproportionately White composition of remote workers.
In 2023, 13.8% of U.S. workers usually worked from home — more than twice the 5.7% that did so in 2019, despite a decrease from 17.9% in 2021 and 15.2% in 2022.
In 2019, around 9 million people worked from home in the United States. By 2023, that number had soared to more than 22 million.
New Data on Remote Workforce
Because of the increased prominence of home-based workers within the U.S. workforce, American Community Survey (ACS) tables have been updated beginning in 2023 to include their key sociodemographic characteristics.
Previously, the ACS subject tables describing worker characteristics according to their means of transportation to work (Tables S0802 and S0804, corresponding to workers’ residence and workplace geographies, respectively) only accounted for workers who commuted by driving alone, carpooling, or public transportation — generally the most common commuting modes prior to the COVID-19 pandemic.
A “worked from home” category was added to both tables. Users can now explore the characteristics of home-based workers relative to other workers.
For example, the workers’ residence geography table (S0802) shows these characteristics of U.S. home-based workers in 2023:
- Their median age was about 43.5, almost two years older than the median age of the total workforce (41.7).
- Roughly two-thirds were White, compared to about one-half of workers who carpooled.
- Around 3.6% were below the poverty level in 2023, compared to 9.3% of workers who commuted by public transportation.
These residence and workplace geography tables (S0802 and S0804) are also available for more detailed geographies like states, metro areas and counties. Examples of the comparisons possible using these publicly available tables include:
- In North Carolina, the median earnings of home-based workers ($65,652) were roughly twice that of public transportation commuters ($30,664).
- In the Denver, Colorado, metropolitan area, 11.8% of home-based workers spoke a language other than English at home in 2023, compared to 20.5% of workers who commuted by driving alone.
- In New York’s Bronx County, 39.3% of home-based workers worked in the management, business, science and arts occupations, compared to 27.6% of all workers.
Other characteristics, such as industry, housing tenure and vehicle availability are also available in these tables, giving data users new insight into the make-up of different groups of commuters.
Because residence and workplace geographies are identical for home-based workers, statistics for this group are also identical in the two tables (S0802 and S0804).
Highlighting Inequality
Earnings and poverty status are common measures to describe inequality within a population.
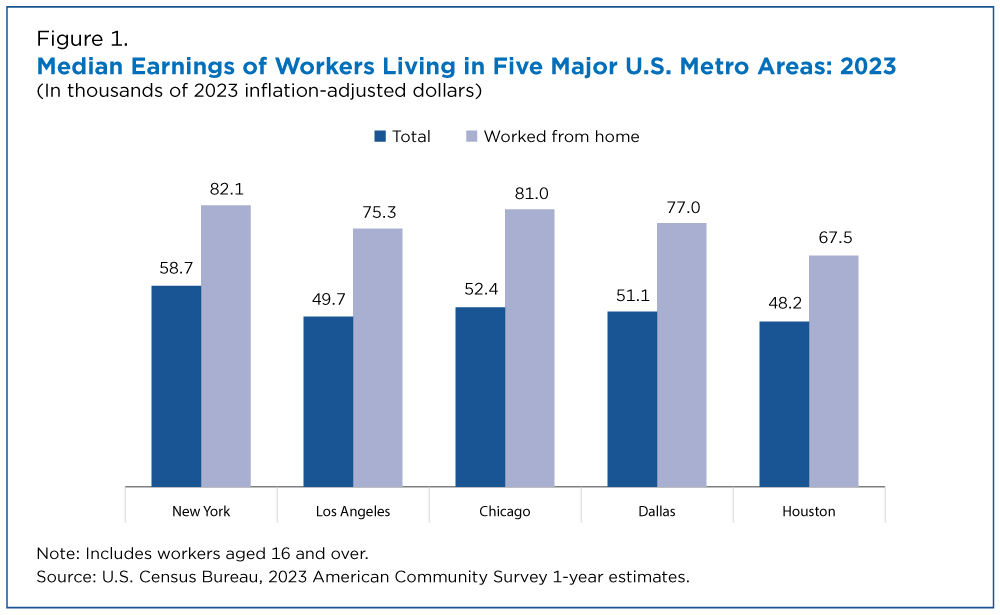
In five of the most populous metropolitan areas in the United States, home-based workers consistently showed higher median earnings than all workers in 2023 (Figure 1).
Among home-based workers in these five metro areas, median earnings were highest in the New York and Chicago metros (over $80,000), and lowest in the Houston metro (under $70,000).
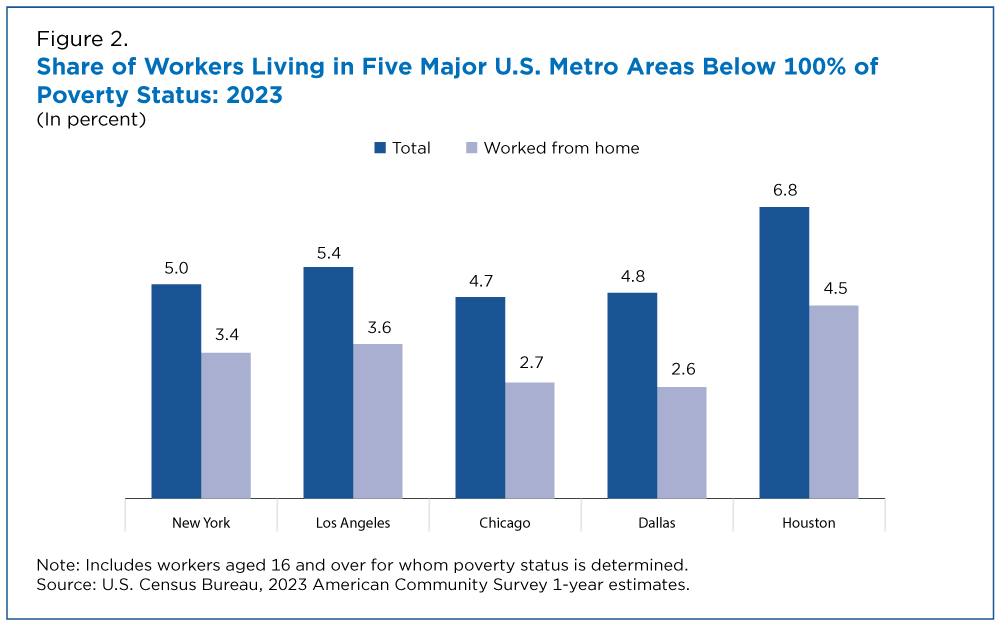
Figure 2 displays the percentage of workers living below the poverty level in five of the most populous metro areas.
In line with their generally higher earnings, a smaller share of home-based workers lived below 100% of the poverty level in 2023 than all workers in each metro area included in this analysis.
Among all workers in these metro areas, the Houston metro had the highest percentage (6.8%) of all workers living below the poverty level.
The dynamic relationship between people and their jobs provides valuable context for understanding numerous dimensions of individual wellbeing. The ACS will continue to collect data that help describe changing commuting and employment trends in the United States.
Related Statistics
Subscribe
Our email newsletter is sent out on the day we publish a story. Get an alert directly in your inbox to read, share and blog about our newest stories.
Contact our Public Information Office for media inquiries or interviews.
Related America Counts Stories
-
PopulationRemote Work During the Pandemic Shifted Daytime Population of CitiesFebruary 21, 2023U.S. Census Bureau tools show how the daytime population of urban job centers declined during the pandemic as more employees worked from home.
-
EmploymentWomen Made Up Majority of Home-Based Workers During PandemicMay 16, 2023The spike in home-based workers during the pandemic slightly increased the share of women working from home.
-
EmploymentMore People in All Race/Ethnic Groups Worked From Home 2019-2021April 06, 2023The number of White, Black, Asian and Hispanic home-based workers more than doubled.
-
IncomeHow Income Varies by Race and GeographyJanuary 29, 2026Median income of non-Hispanic White households declined in five states over the past 15 years: Alaska, Connecticut, Louisiana, Nevada, and New Mexico.
-
HousingRental Costs Up, Mortgages Stayed FlatJanuary 29, 2026Newly Released American Community Survey compares 2020-2024 and 2015-2019 housing costs by county.
-
HousingShare of Owner-Occupied, Mortgage-Free Homes Up in 2024January 29, 2026The share of U.S. homeowners without a mortgage was higher in 2024 than a decade earlier nationwide and in every state, though not all counties saw increases.
-
PopulationU.S. Population Growth Slowest Since COVID-19 PandemicJanuary 27, 2026The decline in international migration was felt across the states, though its impact varied.


