
Linking Health Records to Census Bureau Data Identifies Better Ways to Measure Social Risk
Where you live can shape how long you live and how healthy you are along the way — a connection that has been well-documented for years.
To understand and address this connection, policymakers and researchers need better ways to measure a community’s risks. They have increasingly relied on a variety of area-based measures.
Our findings suggest that where you live is a powerful predictor of serious health conditions and, in many cases, more powerful than income or education level.
But the question is: which one better captures a community’s social risk across both populations and geographies?
Our new study published in JAMA Health Forum linked U.S. Census Bureau socioeconomic data and electronic health records of more than 2.8 million primary care patients to compare widely used area-based measures of social risk.
Our findings suggest that where you live is a powerful predictor of serious health conditions and, in many cases, more powerful than income or education level.
According to the study, people living in deprived areas were more likely to have hypertension, diabetes, and chronic kidney disease and were at higher risk of dying. This held true even after accounting for age, sex, race and ethnicity, and whether someone lived in an urban or rural area.
These findings could help government agencies, health systems and insurers allocate resources and adjust payments to better support underserved communities.
Why Area-Based Social Risk Measures Matter
For decades, researchers and policymakers have tried to measure social risk or the social and economic conditions that make people vulnerable to poor health using two approaches: collecting income, education or employment data on individuals or using area-based measures that more broadly characterize the social and economic conditions of where people live.
Area-based measures can capture health risks beyond personal circumstances, including the quality of housing and job opportunities.
Several state and federal government agencies already use these measures. For example, the Centers for Medicare & Medicaid Services (CMS) and the state of Maryland have directed additional dollars to providers serving patients in more deprived areas based on the results of such measures.
As these measures increasingly shape funding and policy decisions in the United States and abroad, our research explored which one works best. And, more specifically, which measure works equally well for everyone, regardless of race, ethnicity, age or where you live.
Powerful Dataset
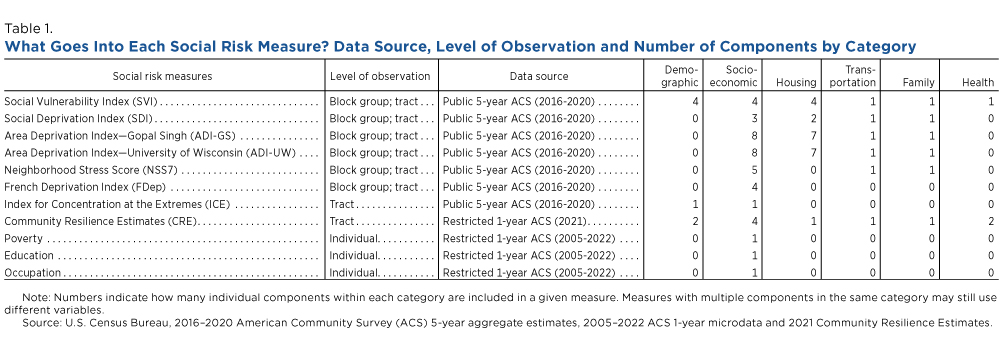
Not all social risk measures are built the same way. Table 1 shows how the 11 measures examined in this study differ in their underlying components, data sources and level of geographic detail.
Researchers from the Census Bureau’s Enhancing Health Data (EHealth) Program, Stanford University, and the American Board of Family Medicine linked electronic health records from more than 2.8 million primary care patients with Census Bureau data to evaluate eight area-based measures and three socio-economic measures currently in use.
By linking data from multiple sources, including the American Community Survey (ACS), national primary care registry and death records from the Social Security Administration, we were able to connect clinical records to demographic and socioeconomic information at the individual level.
This linkage is novel because it allowed us to compare eight commonly used area-based social risk measures directly with individual socioeconomic measures. As a result, we could test how well each measure predicted health outcomes and mortality.
Health outcomes included diagnoses of hypertension, diabetes and chronic kidney disease – three of the most common and consequential health conditions – as well as mortality.
Where You Live Can Predict Your Health
Across all eight area-based measures and four health outcomes studied, the pattern was clear and consistent: patients in the most deprived areas were far more likely – in some cases, more than twice as likely – to have hypertension, diabetes and chronic kidney disease than those in the least deprived areas.
In fact, community characteristics often told us more than someone’s own socioeconomic background about their likelihood of having a chronic illness.
It is important to note this was a cross-sectional study, meaning it captured associations between area deprivation and health at a point in time, rather than establishing that one directly caused the other.
Not All Measures Are Created Equal
Where you live and who you are economically are related but provide distinct windows into social risk, which is why the choice of measure matters. Using one measure when another is more appropriate could lead to misallocation of resources and poorly targeted public interventions.
While all eight area-based measures studied predicted health outcomes to some degree, they did not perform equally well.
All measures showed that area deprivation was associated with worse health across the board and across all health conditions. But our research shows that the Area Deprivation Index (ADI-GS) is the most consistent measure of social risk across health conditions, populations and geographies.
Figure 1 illustrates one of the study’s most important findings: the ADI-GS is the stronger predictor for chronic conditions like hypertension, diabetes and chronic kidney disease, while individual measures like education pull ahead for mortality — suggesting that the best tool depends on what outcome policymakers are trying to address.
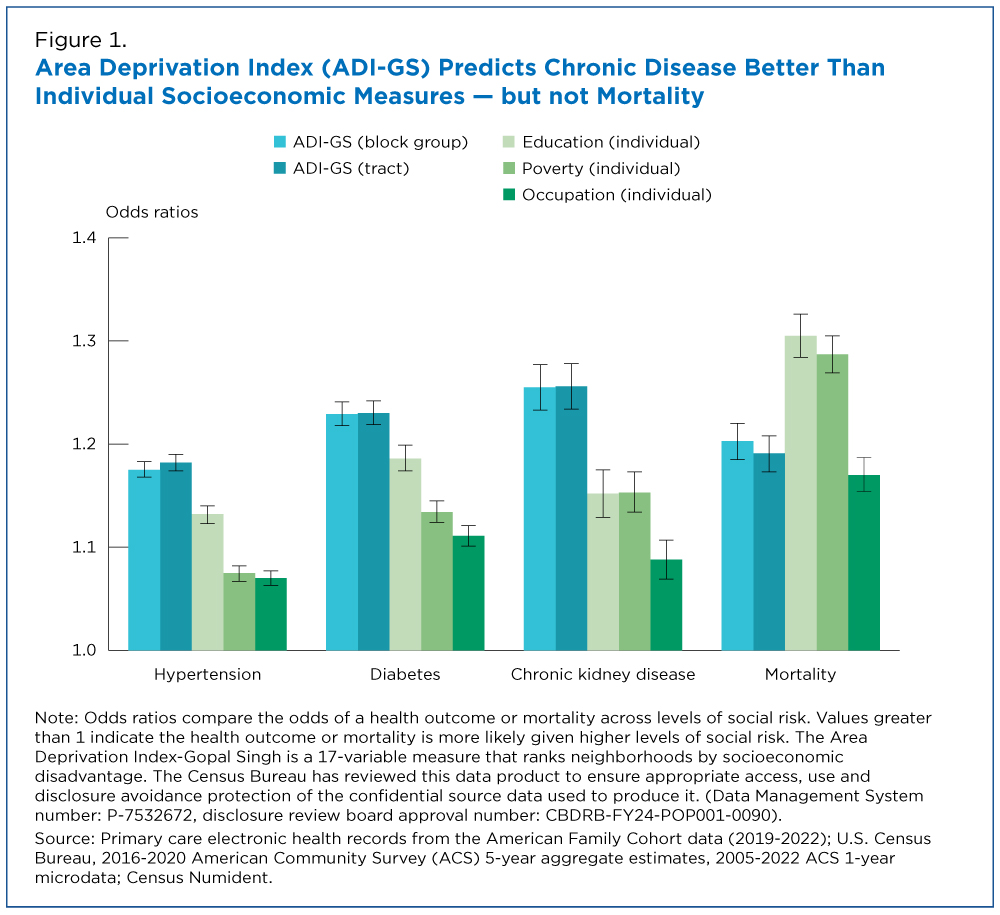
Overall, we found the ADI-GS was the most consistent predictor of poor health outcomes across racial and ethnic groups, rural and urban communities, age groups and sex because of the innovative linkage of electronic health records and Census Bureau microdata.
What sets the ADI-GS apart?
- It standardizes all variables so they contribute equally.
- It performed equally well at both the census block group and census tract levels.
- It was more reliable, especially in rural areas, where some other measures don’t reflect rural conditions that can affect health.
Choice of Measures
Area-based measures outperformed individual socioeconomic measures for predicting chronic disease but the reverse was true for mortality: education level and household poverty were stronger predictors than any of the area-based measures of whether a patient died during the study period than any of the area-based measures.
So, if you want to identify communities at elevated risk for manageable chronic conditions, area-based measures may be the better choice. But for understanding mortality disparities, individual-level data is more valuable.
Area-based measures also performed consistently across most racial and ethnic groups but not across all geographies.
Black, White and Hispanic patients in deprived areas all showed similarly elevated rates of hypertension, diabetes, chronic kidney disease and mortality compared to those in less-deprived areas. But predicting health outcomes and mortality in small towns, rural areas and micropolitan areas was not as accurate.
Additionally, the Census Bureau’s Community Resilience Estimates (CRE) showed statistically significant associations with all four health outcomes even though it was designed to measure vulnerability to disasters rather than health outcomes specifically.
Unlike the other area-based measures, the CRE uses both individual- and household-level data to measure the distribution of vulnerability among individuals in a particular geographic area.
Impact of Research
As health systems and government programs increasingly seek to address social as well as clinical needs, reliable tools can help them identify who needs help most and adjust provider payments fairly.
This study provides the most comprehensive national validation of area-based social risk measures to date. Its core message: area-based measures work but no measure is perfect for every purpose.
These findings demonstrate what is possible when existing data sources are repurposed for innovative statistical use. Additional details, including methodology and limitations, can be found in the published paper.
The Enhancing Health Data (EHealth) Program’s website highlights other research projects.
Related Statistics
Subscribe
Our email newsletter is sent out on the day we publish a story. Get an alert directly in your inbox to read, share and blog about our newest stories.
Contact our Public Information Office for media inquiries or interviews.
Related America Counts Stories
-
Health InsuranceHealth Insurance Coverage Varied Significantly by OccupationSeptember 09, 2025In 2024, farming, fishing and forestry occupations had among the highest uninsured rates among workers ages 19 to 64.
-
HealthHow Age and Poverty Level Impact Health Insurance CoverageSeptember 10, 2024The percentage of people without health insurance remained around 8% in 2023 but rates varied by age and poverty level, according to data released today.
-
Health InsuranceHow Many U.S. Businesses Offer Health Insurance to Employees?February 29, 2024Private-sector companies in seven states and District of Columbia offer health insurance to employees at a rate significantly above the national average.
-
Families and Living ArrangementsU.S. Parents Gave $26.6 Billion to Their Adult Children in 2024September 30, 2026About 2.6 million parents provided financial support to 3.7 million children age 21 and over who did not live at home.
-
Business and EconomyAmerican Manufacturing: A History in Census DataSeptember 28, 2026On the 15th anniversary of Manufacturing Day, we celebrate the sector’s contribution to the U.S. economy.
-
EducationBeyond Diplomas: Nondegree Credentials Linked to Higher EarningsSeptember 22, 2026High school graduates and even those with college degrees earned more with nondegree credentials targeting specific work skills.
-
Emergency PreparednessCalm Atlantic Hurricane Season Could Mean Active One in the PacificSeptember 17, 2026Census Bureau data tools can help communities prepare for and recover from hurricanes and other disasters wherever they are.