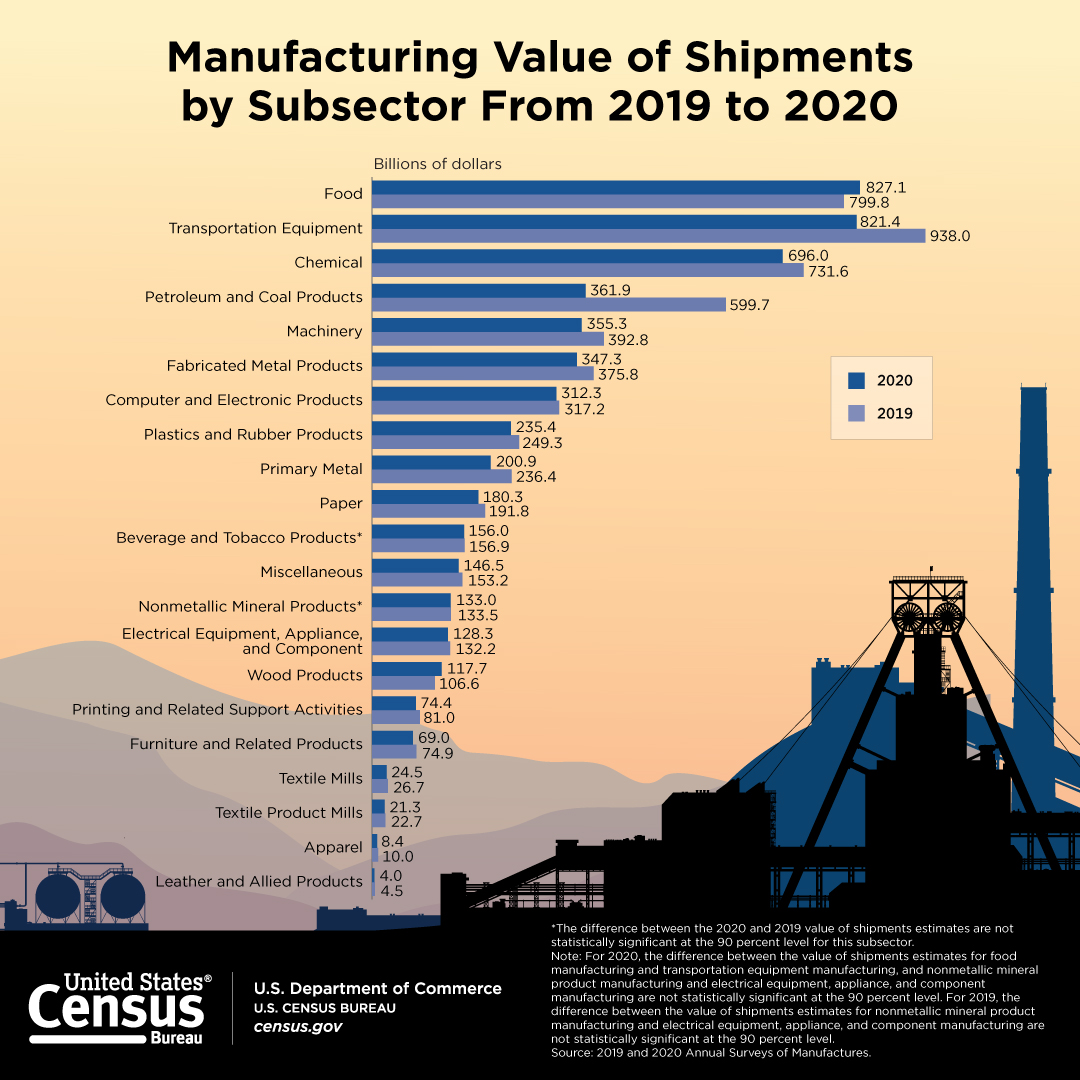
Manufacturing Value of Shipments by Subsector From 2019 to 2020
Manufacturing Value of Shipments by Subsector From 2019 to 2020
Download or Print this Graphic:
*The difference between the 2020 and 2019 value of shipments estimates are not statistically significant at the 90 percent level for this subsector.
Note: For 2020, the difference between the value of shipments estimates for food manufacturing and transportation equipment manufacturing, and nonmetallic mineral product manufacturing and electrical equipment, appliance, and component manufacturing are not statistically significant at the 90 percent level. For 2019, the difference between the value of shipments estimates for nonmetallic mineral product manufacturing and electrical equipment, appliance, and component manufacturing are not statistically significant at the 90 percent level.
Source: 2019 and 2020 Annual Surveys of Manufactures.
Page Last Revised - December 9, 2021


